
Figure 2.
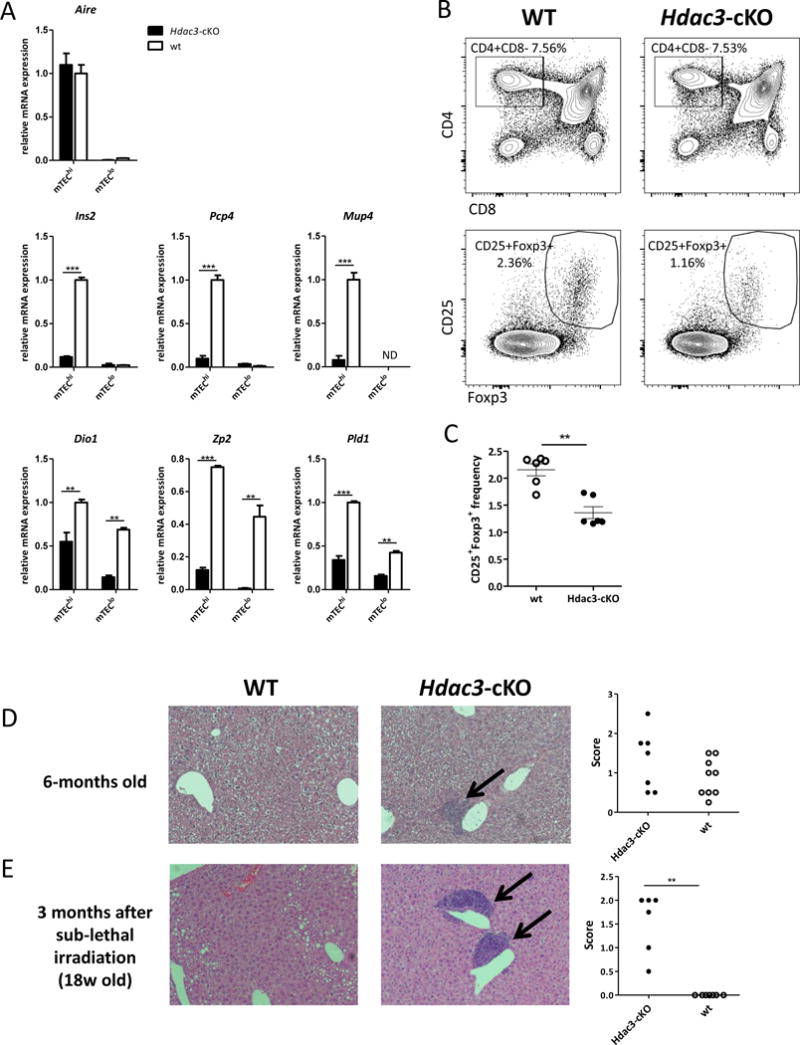
Hdac3-deficient residual mTECs have impaired expression of TRA genes and fail to induce immune tolerance
(a) Quantitative Real-Time PCR analysis assessing the gene expression of Aire, representative Aire-dependent genes (Ins2, Pcp4, Mup4) and representative Aire-independent genes (Dio1, Zp2, Pld1) in sorted mTEChi and mTEClo cells isolated from WT (white) or Hdac3-cKO mice (black); data were normalized to Hprt/Rpl32 mRNA levels and presented as percent of expression in WT mTEChi; Asterisks indicate significant differences (*p < 0.05, **p < 0.001 and ***p < 0.0001). (b) Representative flow cytometric profile showing frequencies of CD4/CD8 thymocytes (upper panel) and CD4+CD25+Foxp3+ tTreg cells (lower panel) obtained from 5-week-old WT and Hdac3-cKO thymi (c) Representative graph showing average frequencies + SEM of CD4+CD25+Foxp3+ tTreg cells isolated from WT (white) and Hdac3-cKO mice (black); Average values are calculated from three WT and three Hdac3-cKO animals, asterisks indicate significant differences (**p < 0.001). (d) Hematoxylin and eosin (H&E) staining of paraffin embedded sections of livers from age-matched (38-week-old) WT and Hdac3-cKO mice assessing immune cell infiltration. (e) H&E staining of paraffin embedded sections of livers from age-matched (18-week-old) WT and Hdac3-cKO mice harvested 3-months following sub-lethal irradiation (~300 rad). Graphs show relative scores of immune cell infiltration severity according to infiltrate size and frequencies. Asterisks indicate significant differences (**p < 0.001) calculated by Mann Whitney nonparametric test.
See also Suppl. Fig. 2.