
Figure 5.
Hdac3 is a master regulator switch of the mTEC-specific transcriptional program
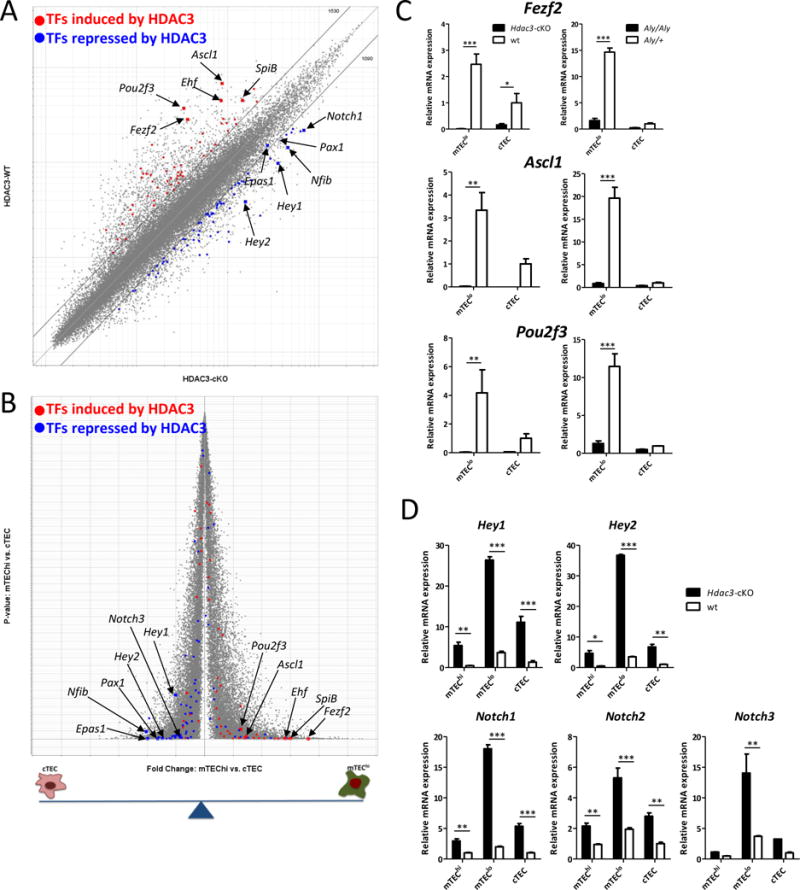
(a) A scatterplot of Affymetrix Mouse Gene 1-ST arrays comparing expression values in residual Hdac3-deficient (x-axis) and WT (y-axis) mTEClo cells. Grey diagonals indicate a 2-fold change cut-off. Highlighted are signatures of the top 50 transcription factors induced by HDAC3 (red) or the top 50 transcription factors repressed by HDAC3 (blue) in TECs. Arrows and gene symbols indicate some of the most Hdac3-dependent transcription factors. (b) A volcano plot of Affymetrix Mouse Gene 1-ST arrays comparing expression profiles of WT mTEChi and WT cTEC populations. Highlighted are signatures of the top 50 transcription factors induced by HDAC3 (red) or the top 50 transcription factors repressed by HDAC3 (blue) in TECs. Arrows and gene symbols indicate some of the most HDAC3-dependent transcription factors (c) Quantitative Real-Time PCR analysis assessing expression of a number of mTEC specific transcription factors genes in sorted mTEClo and cTEC cells isolated from WT (white) or Hdac3-cKO or Aly/Aly mice (both black); Asterisks indicate significant differences (*p < 0.05, **p < 0.001 and ***p < 0.0001). (d) Quantitative Real-Time PCR analysis assessing expression of a number of Notch pathway related genes in sorted mTEChi, mTEClo and cTEC cells isolated from WT (white) or Hdac3-cKO mice (black); data were normalized to Hprt mRNA levels and presented as percent of expression in WT cTEC; Asterisks indicate significant differences (*p < 0.05, **p < 0.001 and ***p < 0.0001).
See also Suppl. Fig. 5.