
Figure 6.
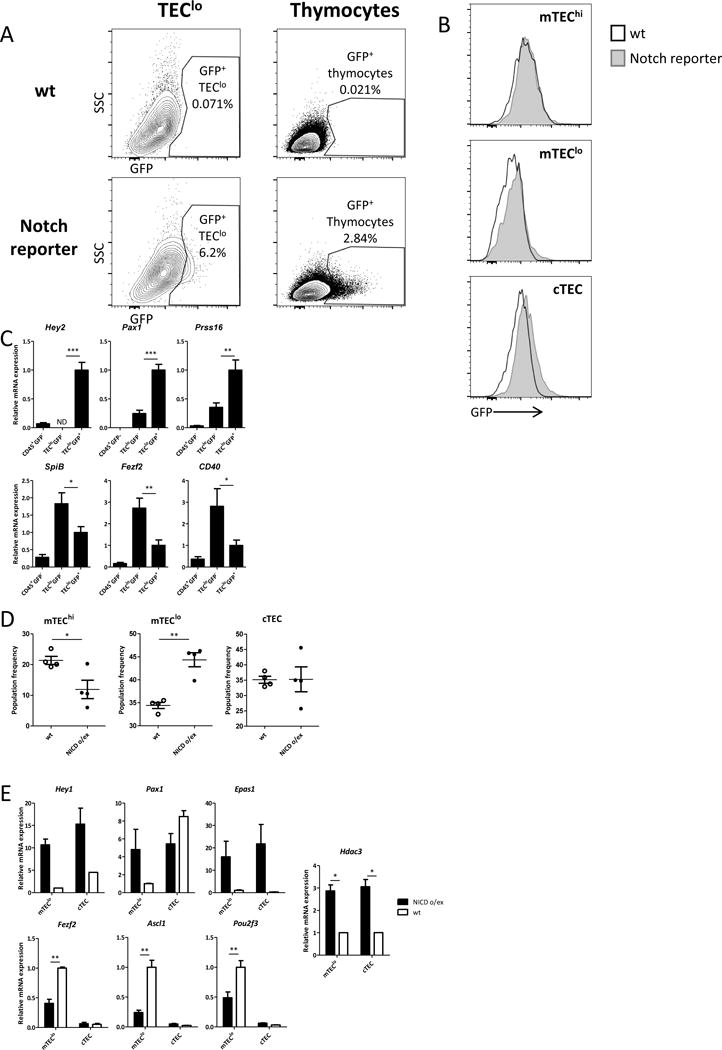
Hdac3-mediated repression of Notch signaling is critical for mTEC development
(a) Representative flow cytometric profiles showing Notch/EGFP+ CD45− EpCAM+CD80lo TECs (left panel) and CD45+ EpCAM− thymocytes (right panel) in Notch/EGFP reporter mice, versus WT controls; (b) Histograms showing EGFP in specific TEC subpopulations gated according to Ly51 and CD80 markers; (c) Quantitative Real-Time PCR analysis assessing expression of a number of Hdac3 repressed genes (upper panel) or induced genes (lower panel) in sorted Notch/EGFP+ and Notch/EGFP− TEC populations isolated from Notch/EGFP reporter mice; data were normalized to Hprt mRNA levels and presented as percent of expression in Notch/EGFP+; Asterisks indicate significant differences (*p < 0.05, **p < 0.001 and ***p < 0.0001). (d) Graphs summarizing changes in flow cytometric profiles of thymic epithelial cell populations from 6-week-old Rosa.flox-STOP-flox–NICDFoxn1.Cre− (WT) and Rosa.flox-STOP-flox–NICDFoxn1.Cre+ (NICD o/ex). Cells were first gated on CD45−EpCAM+ cells and then were analyzed according to Ly51 and MHC-II (IA-IE) expression to depict cortical (cTECs) and medullary (mTECs) epithelial cells either high (mTEChi) or dim (mTEClo) for MHC-II molecule expression (Suppl. Fig. 6D); Asterisks indicate significant differences (*p < 0.05 and **p < 0.001). (e) Quantitative Real-Time PCR analysis assessing expression of a number of Hdac3 repressed genes (upper panel) or induced genes (lower panel) genes and of Hdac3 itself in sorted mTEClo and cTEC cells isolated from WT and NICD o/ex mice; data were normalized to Hprt mRNA levels and presented as percent of expression in WT mTEClo. Asterisks indicate significant differences (**p < 0.001).
See also Suppl. Fig. 6.