
Fig. 4.
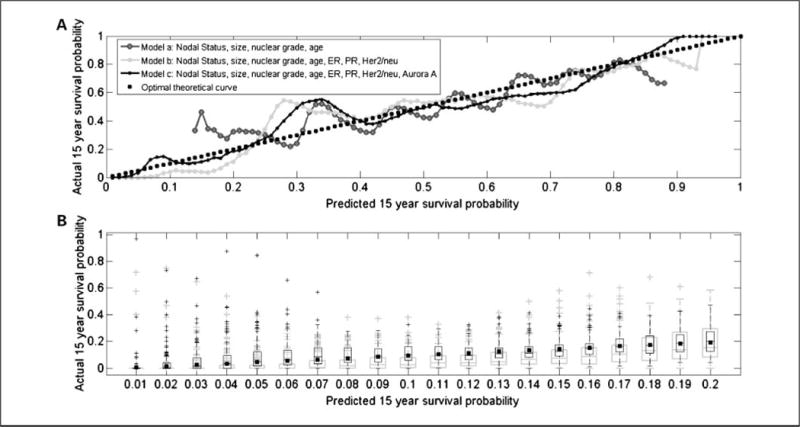
A, actual survival as a function of predicted survival probabilities evaluated in a cross-validation approach. The curves shown correspond to three multivariate Cox models: (a) a model with four binary covariates, nodal status, age (>50 or ≥50), nuclear grade (1 versus 2-3), and tumor size (<2 or ≥2 cm); (b) a model with the above four covariates and ER, PR, and HER-2/neu; and (c) a model containing the continuous Aurora A scores and all the covariates in model b. The quality of each model is detected visually in a manner similar to Q-Q plots and is estimated by similarity (correlation) or dissimilarity (root mean square of residuals) between the curve and the optimal dashed (y = x) line. The curve involving Aurora A has the highest correlation and lowest root mean square of residuals with respect to the optimal dashed (y = x) line. B, box plots of actual survival as a function of predicted survival probabilities evaluated using a bootstrap procedure applied to the cross-validation approach of A. Gray and black box plots, bootstrap results for models b and c, respectively. The bins shown on the X axis are associated with the low survival probability range of [0.0-0.2]. These bins correspond to the first 20 bins of A. The figure shows the superiority of model c over model b in this range, as the actual survival probability (black squares) is contained within each of the interquartile ranges of model c (black boxes) but underestimated by model b (gray boxes).