
Figure 3.
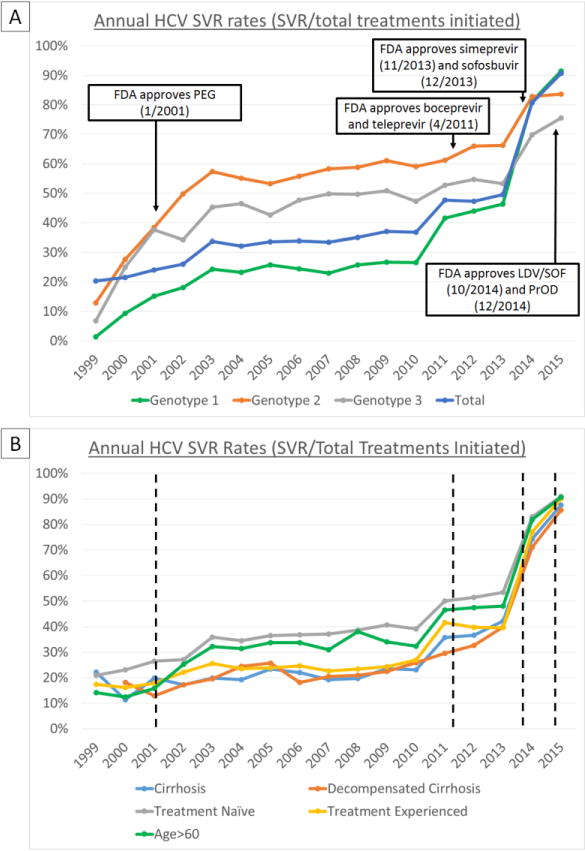
Annual SVR rates by HCV genotype (A) and clinical characteristics (B) with HCV treatment eras demarcated with dashed lines. With each successive introduction of new HCV treatment regimens, SVR rates increased from <25% in the PEG-interferon era (2001-2010) to approximately 50% in 2011-2013 (boceprevir & teleprevir era), 80% in 2014 (simeprevir & SOF era), and >90% in 2015 (LDV/SOF & PrOD era). “Difficult-to-treat” groups such as treatment-experienced patients, and those with cirrhosis or decompensated cirrhosis had lower SVR rates prior to 2014-2015. In 2014-2015, SVR rates for these groups were similar to those of lower risk groups, such as treatment naïve patients.
SVR rates for 2015 only reflect rates from the first half of the year (January-June), due to the large number of patients missing SVR data in the latter half of 2015 (insufficient time elapsed until data pull in April 2016)
PEG = pegylated-interferon,
SOF = sofosbuvir,
LDV/SOF = ledipasvir/sofosbuvir,
PrOD = paritaprevir/ritonavir/ombitasvir/dasabuvir