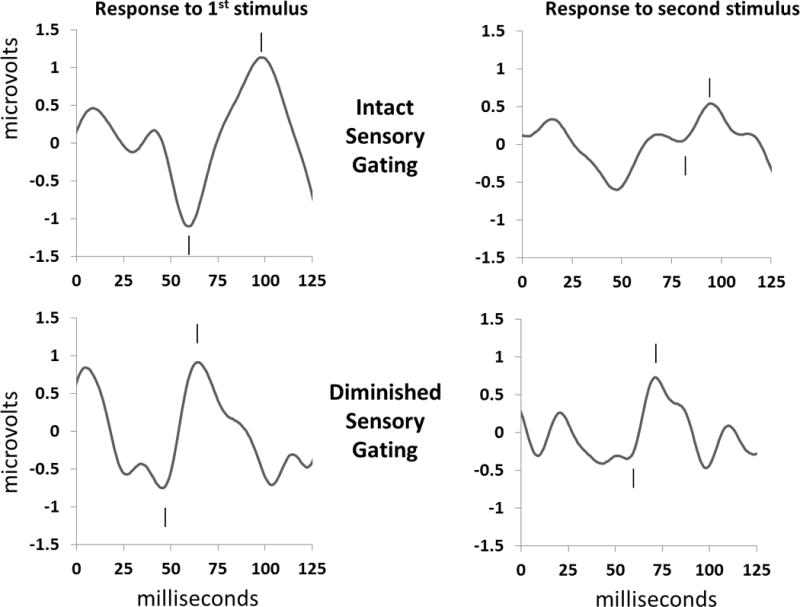
Figure 1.

Representative individual examples of P50 sensory gating responses during active sleep. Clicks are presented 500 ms apart; the P50 response is noted by hashmarks. The positive P50 peak (hashmark above) was measured relative to the preceding negative trough (hashmark below). (A) An example of robust sensory gating in a male infant with an age, adjusted for gestational age at birth, of 51 days. Note that the response to the second stimulus (on the right) is suppressed in comparison to the response to the first stimulus (on the left) for a P50 sensory gating ratio of 0.22. (B) An example of diminished sensory gating in a male infant with an age, adjusted for gestational age at birth, of 58 days. This infant’s P50 response to the second stimulus (on the right) is closer in amplitude to that for the response to the first stimulus (on the left), demonstrating diminished response suppression with a sensory gating ratio = 0.65.
