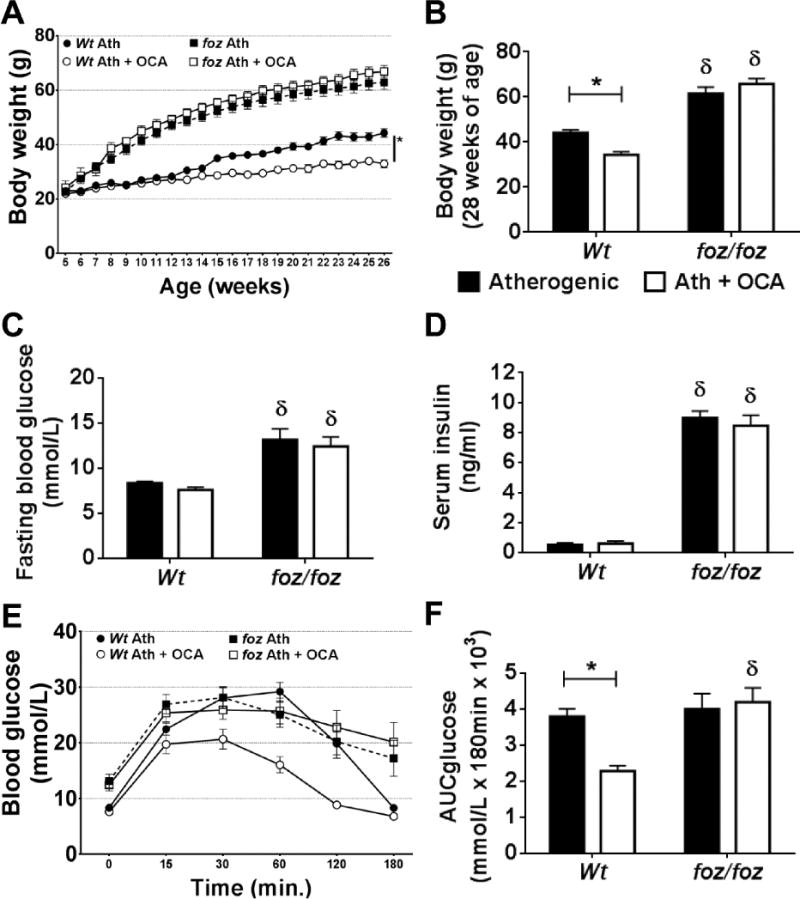
Figure 1. OCA slowed body weight gain and improved glucose tolerance in Wt but not foz/foz mice.

(A) Body weight gain, (B) body weight at 28 weeks, (C) fasting blood glucose (FBG), (D) serum insulin, (E) intra-peritoneal glucose tolerance (IpGTT), and (F) area under the glucose curve (AUC) in atherogenic diet-fed foz/foz mice vs. Wt, with or without OCA treatment. Data are mean ± SEM (n=9-10/gp). *P<0.05 vs. genotype-matched control (treatment effect), δP<0.05 vs. treatment-matched control (genotype effect).
