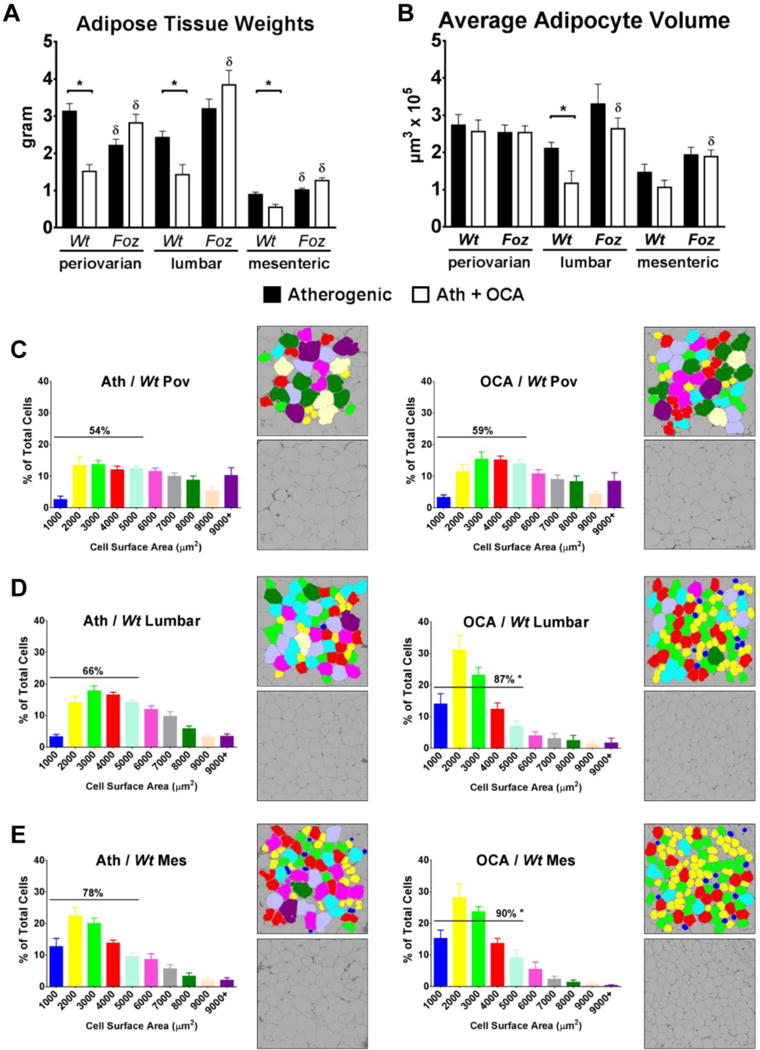
Figure 4. OCA reduced tissue weight and improved morphometry in multiple adipose compartments in Wt but not foz/foz mice.

Changes in adipose compartments in terms of (A) mass and (B) adipocyte mean volume, including detailed size distribution of (C) periovarian (Pov), (D) lumbar, and (E) mesenteric (Mes) adipocytes in atherogenic diet-fed foz/foz mice vs. Wt, with or without OCA treatment. Data are mean ± SEM (n=9-10/gp). *P<0.05 vs. genotype-matched control (treatment effect), δP<0.05 vs. treatment-matched control (genotype effect).
