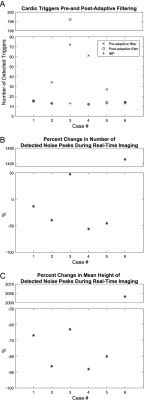
FIGURE 9.
A: Comparison of triggers detected before and after adaptive filtering. The number of triggers detected in the 10 second period decreases from a median of 18 errors to 0 errors, indicating the removal of noise-generated triggers. For this data, the IBP signal which is uncorrupted by EMI was used as a gold standard. B: Percentage change in detected noise peaks due to adaptive filtering. C: Percentage change in mean height of detected noise peaks.

