Figure 1.

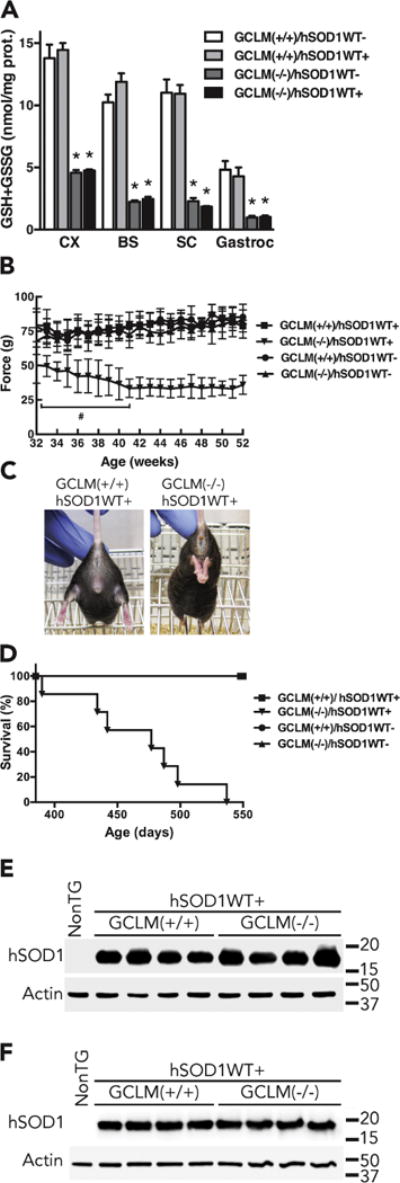
Overt clinical features and decreased life span in GCLM(−/−)/hSOD1WT+ mice. A) Total glutathione (GSH+GSSG) content in different tissues from 48–52 weeks old GCLM(+/+) and GCLM(−/−) mice in the presence or absence of hSOD1WT. CX, brain cortex; BS, brainstem; SC, spinal cord; Gastroc, gastrocnemius muscle. Each bar represents the mean±SD, n=3–4 animals. *Significantly different from its respective GCLM(+/+) tissue (p<0.05). B) Hind-limb grip strength starting at 32 weeks of age. At all ages, the values recorded for GCLM(−/−)/hSOD1WT+ mice are significantly different from GCLM(+/+)/hSOD1WT+ mice (p<0.05, at least n=7 in each group). # Significantly different from 32 weeks old GCLM(−/−)/hSOD1WT+ mice (p<0.05). C) Loss of hind limb extension reflex in a 52 weeks old GCLM(−/−)/hSOD1WT+ mice as compared with an aged-matched GCLM(+/+)/hSOD1WT+ mice. D) Lack of GCLM decreased the life span of hSOD1WT mice to a median survival of 477 days (aprox. 68 weeks) in GCLM(−/−)/hSOD1WT+ animals. Survival curves are significantly different p<0.0001. (At least n=7 in each group, see material and methods for details). E and F) hSOD1 protein expression in spinal cord extracts from 30 days old (E) and 48–52 weeks old (F) non-transgenic (NonTG), GCLM(+/+)/hSOD1WT+ and GCLM(−/−)/hSOD1WT+ mice. No difference was observed in hSOD1WT expression levels between GCLM(+/+)/hSOD1WT+ and GCLM(−/−)/hSOD1WT+ mice when quantified and corrected by actin levels.
