
Figure 2. Genome-wide study of the plasma CVD risk proteome.
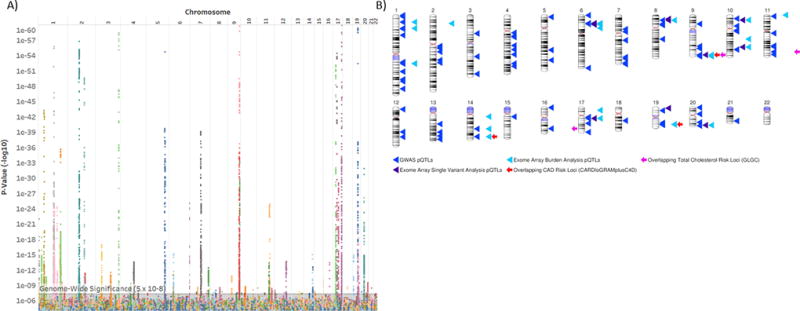
A) The significance of associations between measured SNPs and the 156 plasma proteins associated with FRS. The x-axis depicts the physical order of the genome and the y-axis depicts the P-value (−log10) of the SNP-protein association. Each color depicts an individual protein. The y-axis is truncated at 1×10−60 for clarity. The minimum calculated –log10P was 1.8×10−307 (association between rs3816018 at 5q32 and levels of platelet-derived growth factor receptor beta). B) Ideogram demonstrating pQTLs derived from GWAS and exome array analyses. Overlapping CVD risk loci from consortium studies are shown (Bonferroni significance P ≤ 0.05/120 ≤ 4.2 × 10⁻⁴). Ideogram generated using NCBI Genome Decoration Page.