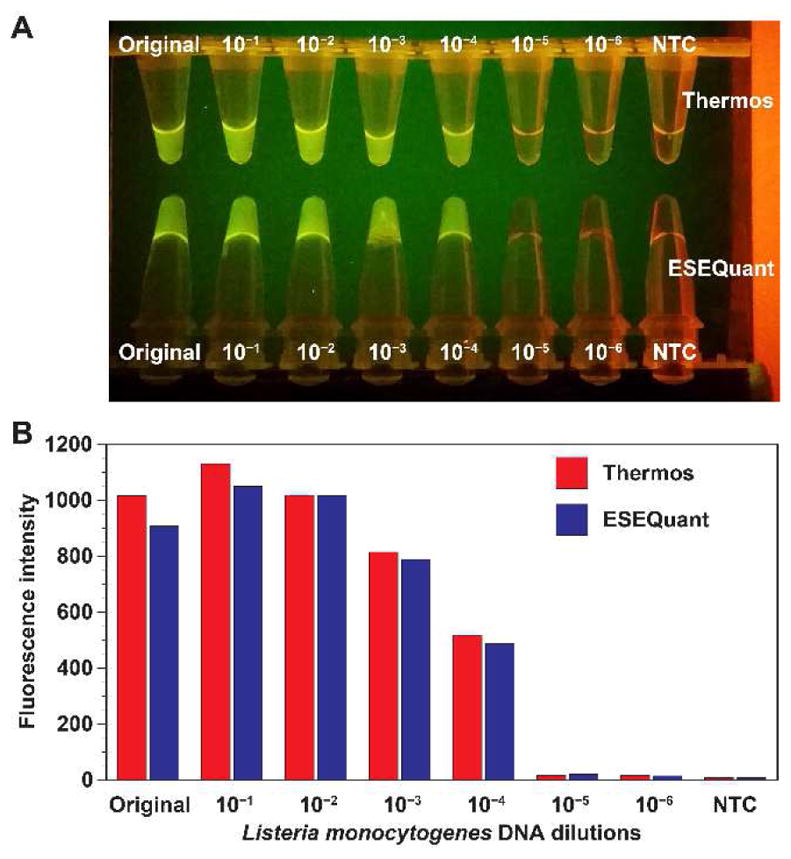
Fig. 7.

A. RPA with serially diluted Listeria DNA templates performed in Thermos vs ESEQuant Tubescanner. Mixing of the tubes were performed 4 min after the reactions have started. The image on a gel box shows that the tubes have high intensity with a higher concentration of the template. Both sets of tubes used in the TTC and the Tubescanner have similar intensity when viewed by the naked eye. The limit of detection is estimated to be 9.6×10² genome copies per 2 μL of DNA template used in the reaction. B. The endpoint fluorescence signal of RPA reaction tubes performed by the TTC (red) was measured by the Tubescanner. The signals of the RPA reaction tubes performed entirely in the Tubescanner are shown in blue.
