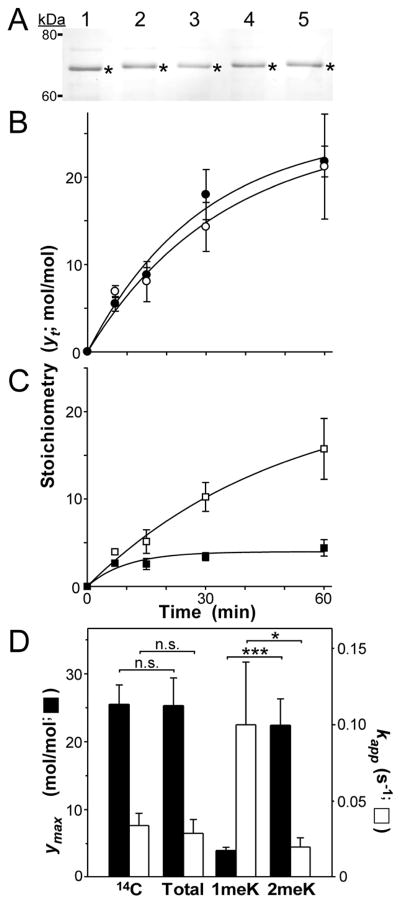
Fig. 2.
Quantification of Lys methylation stoichiometry in tau protein. (A) recombinant human 2N4R tau that was reductively methylated for 0 (lane 1), 7 (lane 2), 15 (lane 3), 30 (lane 4) or 60 (lane 5) min was subjected to SDS-PAGE and Coomassie blue staining. Bands excised for hydrolysis and LC-MS/MS analysis are marked by asterisks. (B) Time course of methylation stoichiometry. Solid circles represent total methylation stoichiometry (in units of mol methyl/mol tau) as a function of time (yt) determined through radiolabeling with [14C]formaldehyde (n = 3) whereas hollow circles represent total methylation stoichiometry determined using LC-MS/MS (n = 3). Solid lines represent best fit of each time series with Eqn. 5. (C) Time course of methylation stoichiometry, where methylation stoichiometry determined by LC-MS/MS in Panel B was disaggregated into its 1meK (solid squares) and 2meK (hollow squares) components. Solid lines represent best fit of each time series with Eqn. 5. (D) Replot of data shown in Panels B and C, where ymax corresponds to the calculated plateau stoichiometry (in units of mol methyl/mol tau) and and kapp corresponds to the pseudo-first order rate constant for each time series. Key: 14C ([14C] formaldehyde labeling), Total (total methylation stoichiometry determined by LC/MS-MS), 1meK (1meK component of LC/MS-MS stoichiometry), and 2meK (2meK component of LC/MS-MS stoichiometry). *, p < 0.05; ***; p < 0.001; n.s., p > 0.05 on z-test (eqn. 6).

