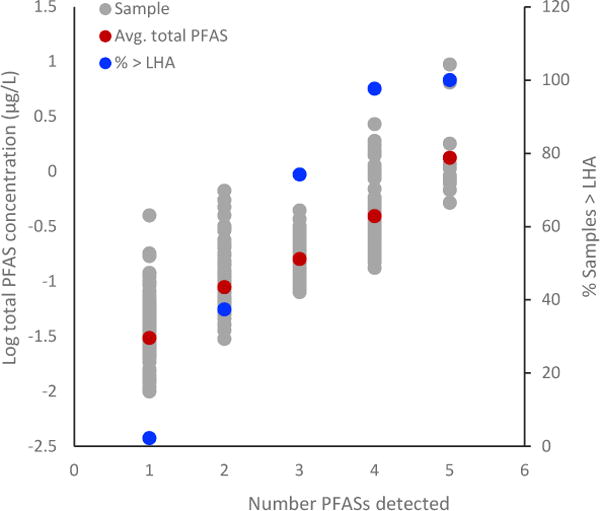
Figure 1.

Summary of total PFAS concentrations (log μg/L) in each sample (left y-axis) sorted by the number of PFASs detected in each sample and percentage of samples in each category exceeding the USEPA LHA (right y-axis). Note calculated averages and LHA exceedances consider only samples in which detections occurred.
