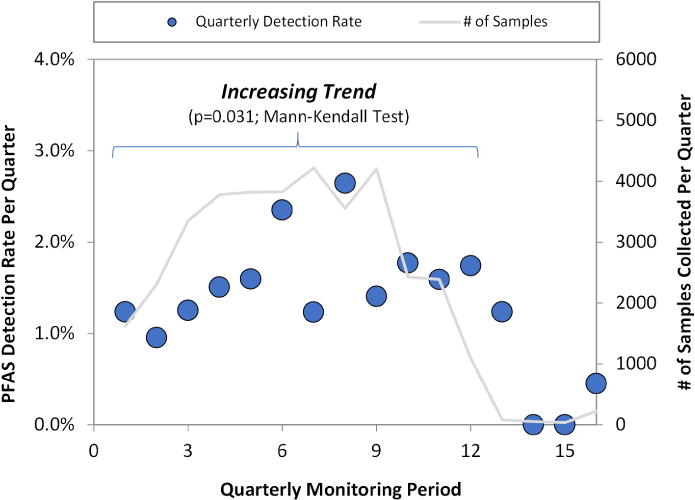
Figure 4.

PFAS Occurrence Trend Using Quarterly Results for All Samples. Data from all UCMR3 samples with analysis of one or more PFAS were grouped by monitoring period (quarterly). The Mann-Kendall test was used to evaluate the trend in detection frequency for data from the first 12 quarters (2013–2015). Data from the last 4 quarters (2016) were not used due to the low number of samples per quarter (<2% of total). Circles are detection rates and correspond to the left y-axis; lines are the number of samples per quarter and correspond to the right y-axis.
