
Figure 3. DCPS protein interacts with components of pre-mRNA metabolic pathways.
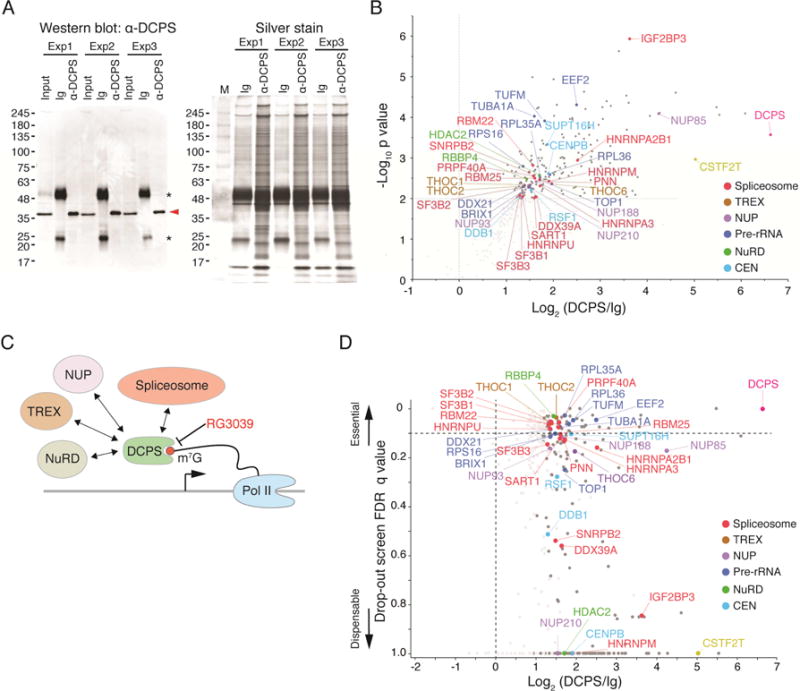
(A) Immunoprecipitation (IP) of endogenous DCPS protein was performed in triplicate. DCPS was detected (red arrowhead) by Western blot when IP was performed with anti-DCPS antibody but not with control immunoglobulins (Ig), indicative of specificity (left). Asterisks denote non-specific immunoglobulin light and heavy chain signals. Protein lysates used for mass spectrometry were analyzed by SDS-PAGE and silver stained (right). (B) Volcano plot displaying results of triplicate IP/mass spectrometry experiments. Y-axis shows negative log10 p values, which represent reproducibility of events among three independent experiments; x-axis indicates log2 ratio of normalized protein abundance between anti-DCPS antibody and control Ig IPs. (C) Proposed model for nuclear DCPS function. DCPS complexes with components of pre-mRNA processing pathways including, spliceosomes, the transcription-export complex (TREX) and the nuclear pore complex (NUP). (D) Genes encoding DCPS-interacting proteins were found essential for AML survival in CRISPR-Cas9 screens. The Y-axis shows the lowest FDR q-value of each gene among 4 dropout screens (GeCKO library A and B screens in CALM/AF10 or MLL/AF9 cells); the X-axis indicates log2 ratio of normalized protein abundance between anti-DCPS antibody and control Ig IPs. See also Figure S4 and Table S4.