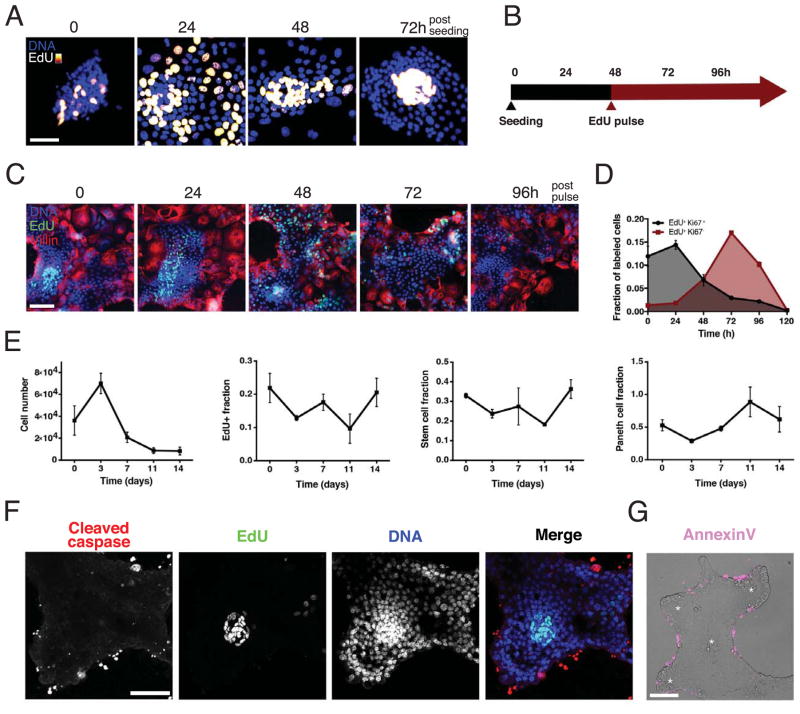
Figure 2.
Enteroid monolayers are dynamically established and maintained.
(A) Time course of crypt development after seeding on ECM. Cells labeled with EdU two hours before fixation at indicated time. Scale bar = 25 μM. (B) Timeline of experiments. (C, D), Pulse-chase time-course experiment shows tissue turnover time of ~4 days. Enteroids were pulsed with EdU two hours prior to time 0 and then chased with fresh media lacking EdU. (C) Representative images of enteroid monolayer cultures, fixed and stained for DNA (blue), EdU (green) and Villin (red) at indicated times post EdU pulse. Scale bar = 50 μM. (D) Quantification of pulse-chase experiment showing colocalization of EdU with the proliferation marker Ki67 (grey, Ki-67+ and EdU+) and colocalization of EdU with non-proliferative cells (red, Ki-67− and EdU+); Error bars represent mean ± SEM of triplicate wells, each containing ≥10000 cells. (E) Quantification of total cell number, fraction of EdU+, fraction of stem cells (OLFM4+), and fraction of Paneth cells (lysozyme+) in enteroid cultures over a two-week time course. Error bars represent mean ± SEM of triplicate wells. (F) Cleaved caspase staining shows apoptosis occurs in the non-proliferative regions as opposed to the proliferative crypt regions (EdU+). Scale bar = 50 μM. (G) Annexin V staining (magenta) overlay on phase contrast image shows cell death occurs on the margins of tissues. Asterisks denote clusters of Paneth cells. Scale bar = 50 μM. See also Figure S3.

