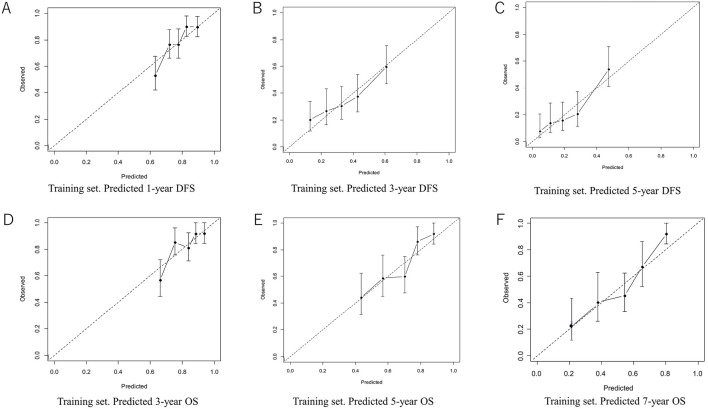
Figure 4.
Calibration curves for the nomogram-predicted probability of the 1- (A), 3- (B), and 5- (C) year DFS and the nomogram-predicted probability of the 3- (D), 5- (E), and 7- (F) year OS in the training set. Curves for a hypothetical ideal nomogram are represented by dashed lines, and those for the current nomogram are represented by solid lines. Vertical bars indicate 95% confidence intervals. DFS: disease-free survival, OS: overall survival

