Figure 1.

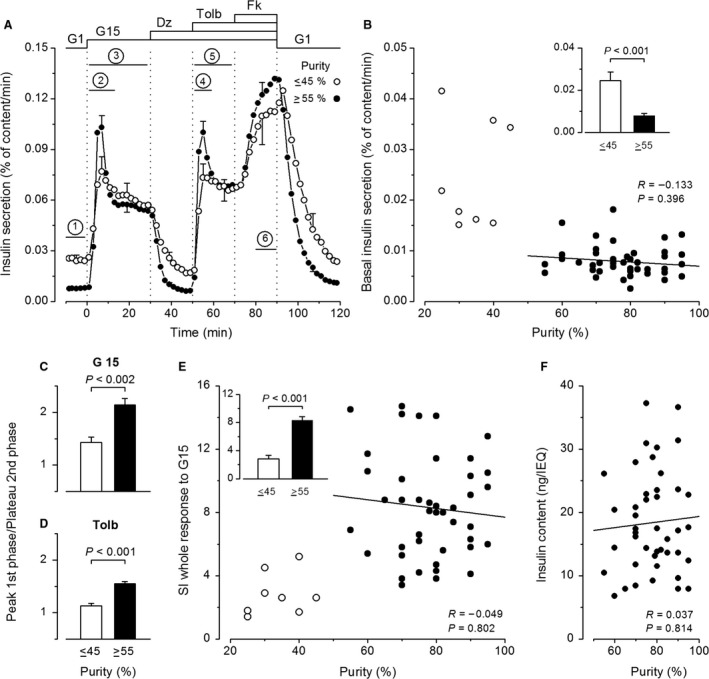
Influence of the purity of human islet preparations on insulin secretion. (A) Dynamics of insulin secretion in preparations with purities ≤45% or ≥55% (n = 8 and 43, respectively). Experiments started with a 60‐min stabilization period, of which only the last 10 min are shown. Between 0 and 90 min, the concentration of glucose was increased from 1 (G1) to 15 mmol/L (G15). Diazoxide (Dz; 100 μmol/L), tolbutamide (Tolb; 100 μmol/L), and forskolin (Fk; 1 μmol/L) were added and withdrawn as indicated. Bars labeled 1–6 show time periods over which insulin secretion rates were averaged for subsequent analyses as described in Results. (B) Basal insulin secretion rate in G1. (C–D) Ratio of secretion rates at peak of first phase and plateau of second phase of responses to G15 (C) and Tolb (D). (E) Stimulation index (SI) for the whole insulin response to G15. (F) Islet insulin content normalized to islet equivalents (IEQ). A, C and D, and insets in B and E compare means ± SE for preparations with low and high purity. P values were calculated by Mann–Whitney test. B, E and F show individual values as a function of the purity of each islet preparation. Correlation coefficients were calculated by the test of Spearman for the group of high purity only.
