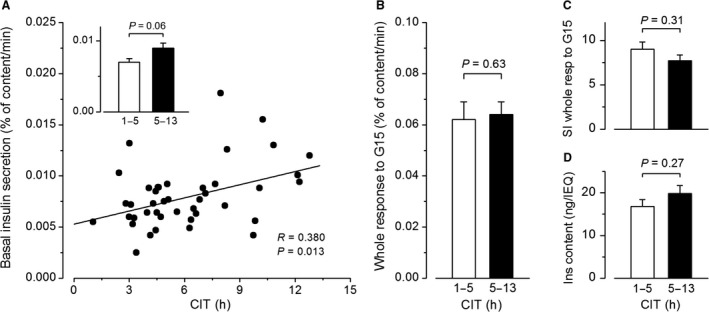
Figure 3.

Influence of cold ischemia time (CIT) on insulin secretion by isolated human islets. (A) Basal insulin secretion rates in G1 as a function of CIT. The correlation coefficient was calculated by the test of Spearman. (B) Whole insulin response to G15. (C) Stimulation index (SI) for the whole response to G15. (D) Normalized islet insulin content. The inset in A, and B–D compare means ± SE for 20 preparations with short (1–5 h) and 22 preparations with longer (5–13 h) CIT (Mann–Whitney test).
