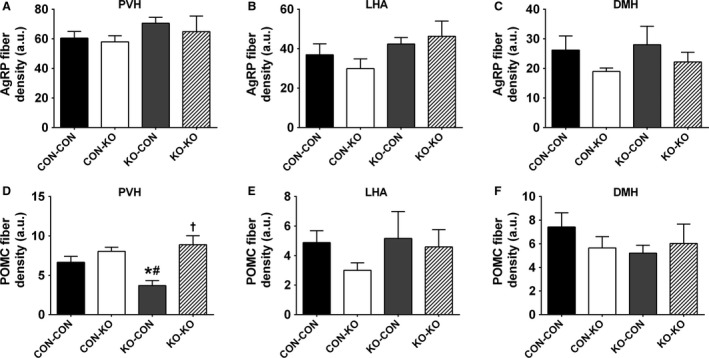
Figure 8.

Axonal projections of ARH neurons. (A–C) Bar graph comparing AgRP fiber density in the PVH (A), LHA (B), and DMH (C) in males consuming regular chow (n = 7/group). (D–F) Bar graph comparing POMC (β‐endorphin) fiber density in the PVH (D), LHA (E), and DMH (F) in males consuming regular chow (n = 6/group). *Significantly different (P < 0.05) compared to CON‐CON group. #Significantly different (P < 0.05) compared to CON‐KO group. †Significantly different (P < 0.05) compared to KO‐CON group.
