
Fig. 2.
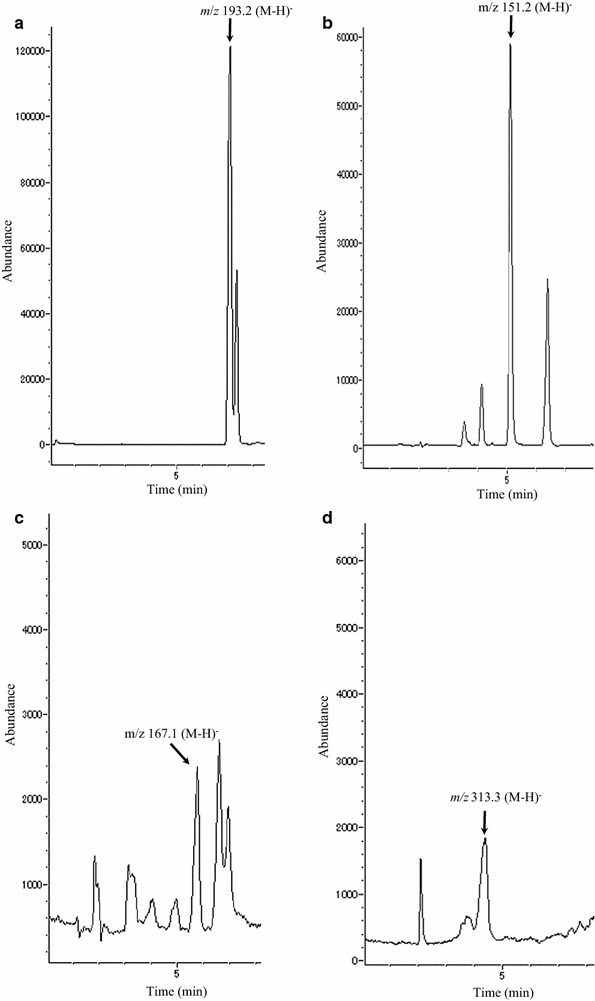
Total ion chromatogram obtained from the biotransformation of phenolic compounds in Aspergillus luchuensis. The total ion chromatogram (TIC) was measured by LC/MS. Each TIC mass spectrum for a ferulic acid ((M-H)−, 193.2), b vanillin ((M-H)−, 151.2), c vanillic acid ((M-H)−, 167.1), d vanillin glucoside ((M-H)−, 313.3) and individual retention times were identical to those of the authentic compounds