Figure 1.
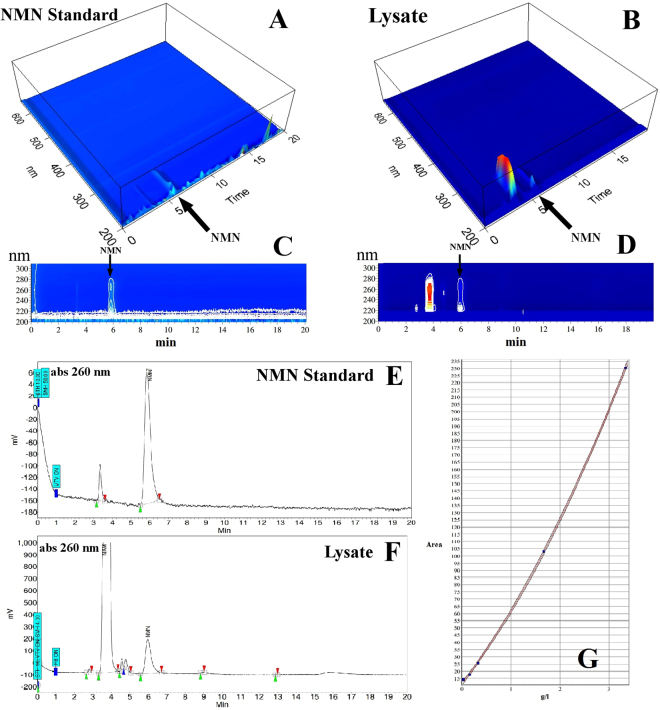
HPLC SEC separation of nicotinamide mononucleotide (NMN). The light absorption spectra (200–600 nm) (A,B), (200–300 nm) (C,D) were recorded by the Jasco Photodiode Array (PDA) detector. (E,F) represent 260 nm chromatograms extracted from above PDA data. Mobile phase was 50 mM formic acid, with a flow rate 3 mL/min, the stationary phase was PolyHEA, column dimensions: 250 × 9.4 mm; 5 μm, 60-Å. Sample volume was 20 μL of 5 mM nicotinamide mononucleotide standard (Sigma Aldrich, however impure, as shown) (A,C,E), respective bacterial cell lysate (B,D,F). NMN elutes at 5.7 minutes and is clearly separated from other similar molecules (e.g. nicotinamide which has a similar light absorption spectrum, is more abundant in the bacterial lysate and elutes at 3.8 minutes). The second polynomial order calibration curve with a correlation coefficient of 0.99 was obtained for quantitative determination by integration of the peak area of 5 NMN samples with known concentration levels: 0.03; 0.16; 0.33; 1.67; 3.34 g/L (G).

