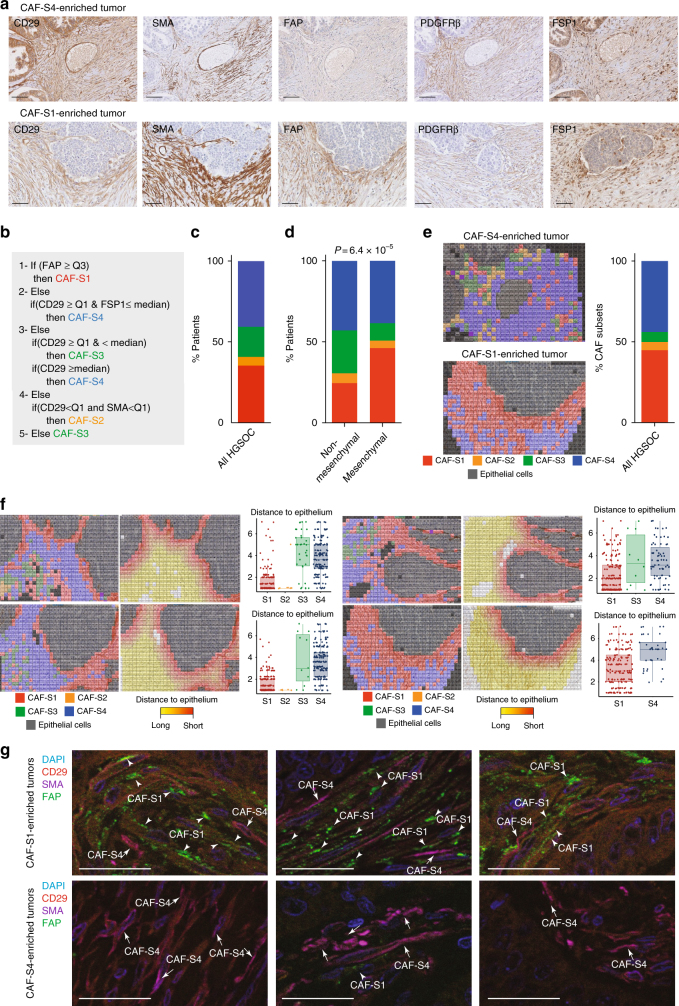
Fig. 2.
Mesenchymal HGSOC accumulate mostly the CAF-S1 subset. a Representative views of CD29, SMA, FAP, PDGFRβ, and FSP1 immunostaining of serial sections in CAF-S4- or CAF-S1-enriched HGSOC. Scale bar, 100 μm. b Decision tree used to define CAF identity, based on four equal quartiles (Q) and median (Mdn) distribution of each CAF marker intensity. Thresholds (Mdn, Q) and order of decisions were first established from FACS data of a prospective cohort of HGSOC patients (N = 22) and next transposed to values of IHC data, using a learning set of tumors containing both non-activated and activated CAF (N = 60). c Bar plot showing percentage of HGSOC according to the predominant CAF subset detected in each tumor. CAF enrichment per tumor is defined by applying the histological scores of all markers on the decision tree described in (b). HGSOC enriched in CAF-S1 (red), CAF-S2 (orange), CAF-S3 (green), or CAF-S4 (blue) are shown as percentage (%). N = 118 HGSOC patients. d Same as in (c) considering mesenchymal (N = 66) versus non-mesenchymal (N = 49) HGSOC. P values are from Fisher’s exact test. e Maps of CAF subsets at cellular level, corresponding to the tumor sections shown in (a). Each square of 225 μm2 corresponded on average to a single cell. Each CAF subset is represented by a color code and epithelial cells are in grey. The bar plot shows the percentage of HGSOC according to the predominant CAF subset evaluated on CAF maps at cellular level (N = 9). f Representative views of CAF maps, with their corresponding heatmaps showing the distances (shortest in red, farthest in yellow) between cancer cells and CAF subsets. Scatter plots show the distance to epithelial cells according to CAF subsets (distance calculated in a maximum area of five successive tiles in x and y). Data are shown as mean ± SEM (n = 425 cells per image in average). P values are from Student’s t-test. g Representative images showing triple immunofluorescence co-staining of CD29 (red), FAP (green), and SMA (violet) markers in HGSOC enriched in CAF-S1 (arrowheads) or CAF-S4 (arrows). Scale bar, 50 μm

