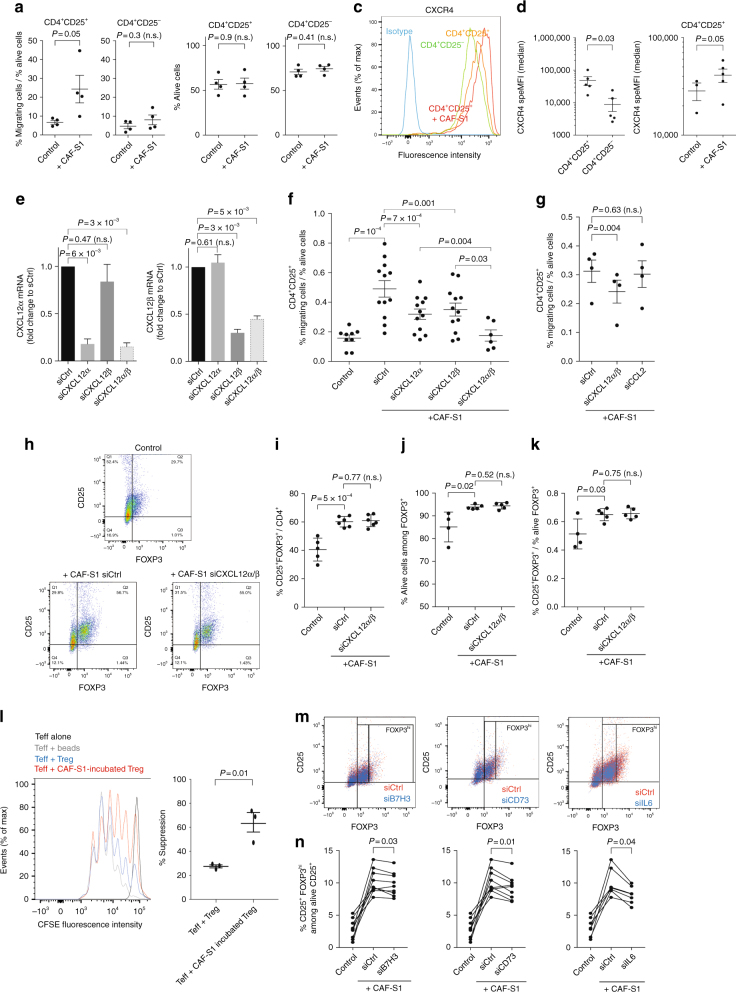
Fig. 5.
CAF-S1 stimulate CD25+FOXP3+ T lymphocytes. a Percentage of CD4+CD25+ or CD4+CD25− lymphocytes migrating towards CAF-S1. Data are shown as mean ± SEM. n = 4 independent experiments. P values from Student’s t-test. b Percentage of alive CD4+CD25+ or CD4+CD25− T lymphocytes in absence (Control) or presence of CAF-S1. Data are shown as mean ± SEM. n = 4. P values from Student’s t-test. c Density curves showing CXCR4 expression in CD4+CD25− (green), untreated CD4+CD25+ (orange) or after culture with CAF-S1 (red), compared to control isotype (blue). Cell count is normalized, as percentage of maximal number of cells (% of max). d CXCR4 protein levels in CD4+CD25− or CD4+CD25+ lymphocytes without (Control) or with CAF-S1. Specific MFI are shown as mean ± SEM. n = 5. P values from paired ttest. e CXCL12α and CXCL12β mRNA levels after silencing of CXCL12α- or/and CXCL12β in CAF-S1 cells. Data are shown as mean ± SEM of fold change to control. n = 5. P values from one sample ttest. f Percentage of migrating CD4+CD25+ lymphocytes after CXCL12α/β silencing in CAF-S1 cells. Data are shown as mean ± SEM. n = 5. P values from paired ttest. g Same as in (f) after CXCL12α/β or CCL2 silencing. n = 3. h Flow cytometry plots showing CD4+CD25+ and FOXP3+ cells in absence (Control) or presence of CAF-S1 transfected with siCtrl or silenced for both CXCL12α and β (siCXCL12α/β). i, j, k Percentages of CD25+FOXP3+ among CD4+ cells (i), of alive CD25+FOXP3+ lymphocytes (j) and of CD25+FOXP3+ lymphocytes relative to alive cells (k). Data are shown as mean ± SEM. n = 4. P values from Student’s t-test. l CFSE fluorescence intensities quantifying CD4+ effector T cells (Teff) proliferation. Teff were incubated alone (black curve), with CD3+CD25+ beads (grey), or in presence of CD4+CD25HighCD127lowCD45RAlow (+Treg) either pre-incubated with CAF-S1 fibroblasts (red) or not (blue). Scatter plot shows percentage of suppression (see Methods). m Flow cytometry plots showing CD4+CD25+FOXP3+/− cells without (Control) or with CAF-S1 transfected with siCtrl or silenced for B7H3, CD73 or IL-6. n Percentages of alive FOXP3High lymphocytes as in (m). P values from paired ttest. n ≥ 6

