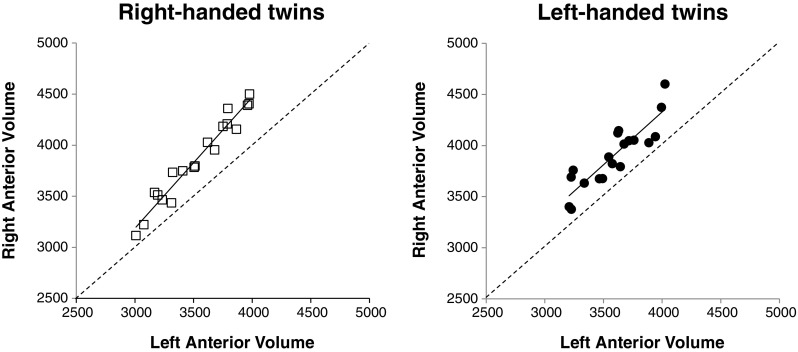
Fig. 3.

Anterior cerebellar lobule volumes plotted by right and left hemispheres for RH and LH twins. Regressions are plotted as solid lines. The identity lines are plotted as dashed lines. Volumes show averaged measures for lobules IV and V (in mm3).
