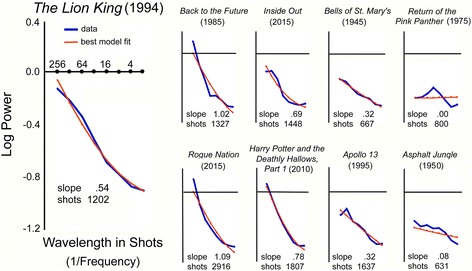
Fig. 3.

Power spectra for the data (in blue) of and model fits (in red) to the shot-duration fluctuations of nine movies. These reflect a power analysis on the normalized shot vectors for each movie. Notice three trends: steeper-sloped movies tend to be more recent, more recent movies tend to have more shots, and model fits tend to be better for movies with more shots. These parallel trends form the focus of Studies 1–4
