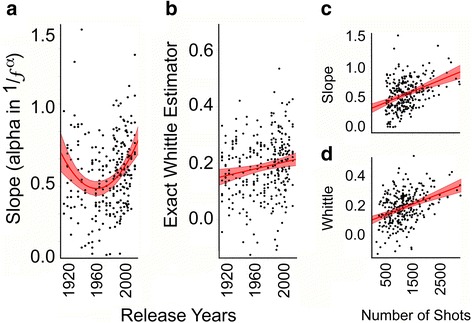
Fig. 4.

Results of Studies 1 and 2 plotting values of fractal measurements per movie against release years and against number of shots per movie. Shown are four scatterplot results for movies released between 1915 and 2015. a Alpha values (slopes) of 263 movies as a quadratic function of release year (Study 1). Only the right half of that function fits the data well. b The exact Whittle estimate values for 295 movies as a linear function of release year (Study 2). c The slopes as a function of the number of shots in 263 movies (Study 1). d The Whittle estimates for 295 movies as a function of the number of shots (Study 2). Colored areas are 95% confidence intervals on the regressed fits
