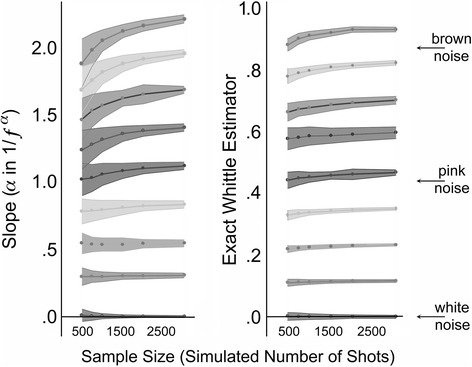
Fig. 5.

Results of Study 3 investigating the relation between length of vectors and their fractal dimension. The panels show means (as points) and standard deviations (not confidence intervals) as shaded areas of noise simulations. Each point represents the mean of 1000 simulation trials. Noises were generated by algorithm (Little et al., 2007) and fit by the models used in Study 1 (measuring slope) and in Study 2 (measuring Whittle estimators by the method of Shimotsu & Phillips, 2005). In each panel, noises were generated with intended slopes of 0.0 to 2.0 in intervals of 0.25. Whittle values average about 43% of slope values in these simulations
