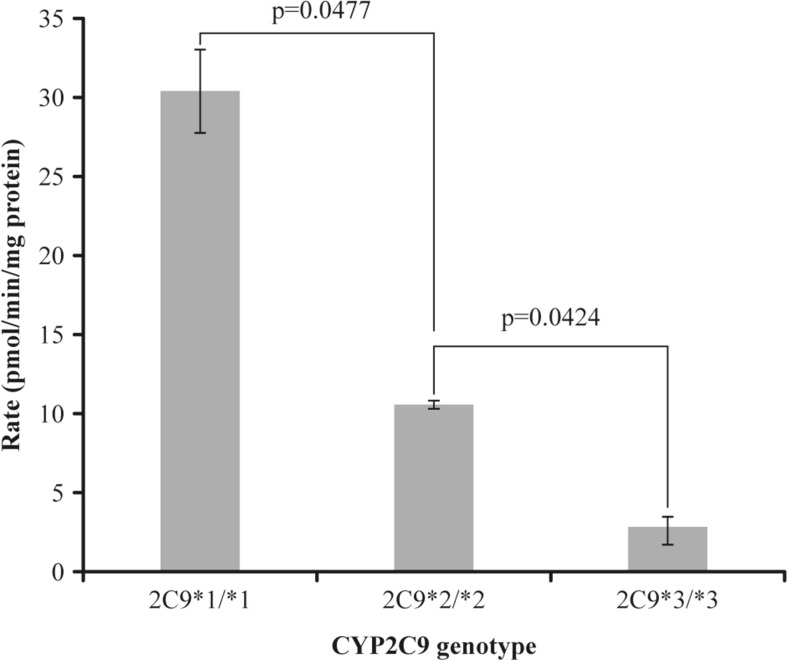
Fig. 3.
Comparison of [14C]siponimod metabolism rates in human liver microsomes (HLM) from individual donors with three different CYP2C9 genotypes. Formation of total metabolites was quantified by HPLC with radioactivity detection. Student’s t tests are applied for comparing the significant difference of CYP2C9*1/*1 to CYP2C9*2/*2 (p value 0.0477) and CYP2C9*1/*1 to CYP2C9*3/*3 (p value 0.0424), respectively. CYP cytochrome P450

