Fig. 1.
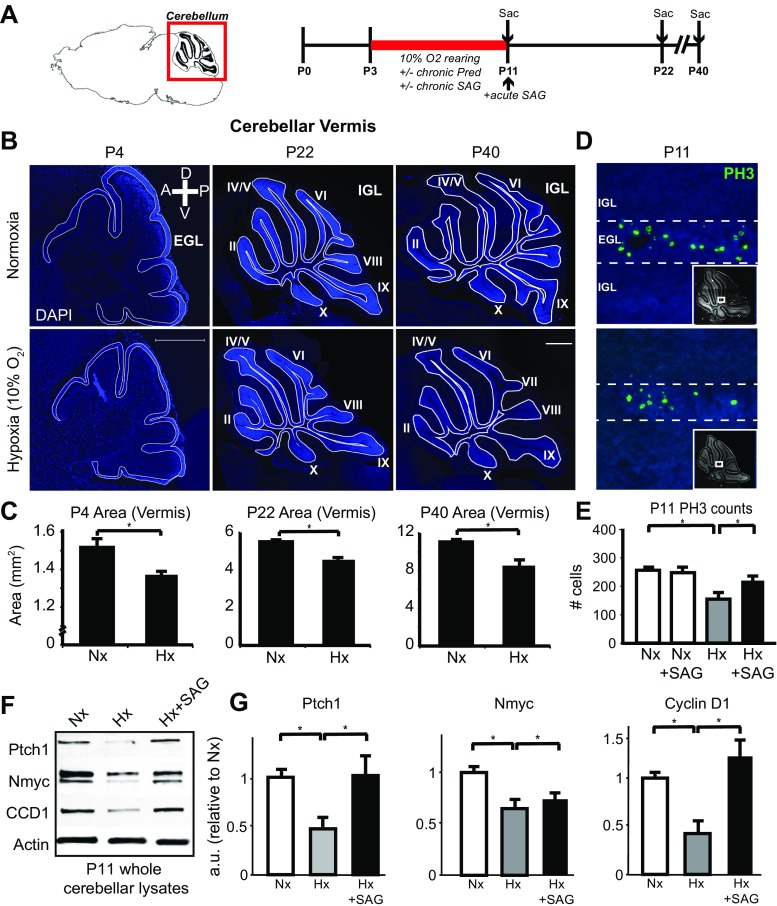
Chronic hypoxic rearing in postnatal mice results in permanent cerebellar hypoplasia through decreased CGNP proliferation and Shh signaling. a Schematic of anatomical region of hindbrain and cerebellum at vermis level, and experimental timeline for chronic hypoxic rearing, and for administration of prednisolone, SAG, or combination according to “chronic” (P3–P11) or “acute” (P11 only) schedule. b Representative images showing sagittal section of cerebellar vermis at different timepoints stained with DAPI. A anterior, P posterior, D dorsal, V ventral. Scale bar 500 μm. Outline of external granule cell layer (EGL) at P4 for localization of CGNP, and internal granule cell layer (IGL) at P22 and P40 for localization of CGNs. c Quantification of cerebellar cross-sectional area in normoxic (Nx) versus hypoxic (Hx) reared animals at P4, P22, and P40. At P4, area in Nx = 1.52 ± 0.0465 mm2 (n = 3), Hx = 1.37 ± 0.0181 mm2 (n = 3), P = 0.0432; P22, Nx = 5.49 ± 0.104 mm2 (n = 3), Hx = 4.56 ± 0.119 mm2 (n = 3), P = 0.00449; P40, Nx = 11.05 ± 0.1015 mm2 (n = 3), Hx = 8.527 ± 0.6121 mm2 (n = 4), P = 0.018. d Representative images showing proliferation in the EGL analyzed at P11 by PH3 staining; arrows denote PH3+ cells in the EGL; insert, representative area seen in whole cerebellum. e Quantification of PH3-positive cells in the EGL. Nx = 258 ± 11.9 cells (n = 3), Nx + SAG = 250 ± 9.63 cells (n = 3), Hx = 151 ± 25.1 cells (n = 4), Hx + SAG = 219.5 ± 18.2 cells (n = 3), p = 0.002. f Protein analysis of Shh target genes by Western blot; representative blots showing Patched1 (Ptch1), Nmyc, and Cyclin D1 (CCD1) levels under normoxic (Nx), hypoxic (Hx), and hypoxic + SAG (Hx + SAG) conditions. g Quantification of Shh proteins. Ptch1, Nx = 1 ± 0.0765, Hx = 0.470 ± 0.118, Hx + SAG = 1.0176 ± 0.282. Nmyc, Nx = 1 ± 0.0611, Hx = 0.649 ± 0.090, Hx + SAG = 0.740 ± 0.114. CCD1, Nx = 1 ± 0.0647, Hx = 0.424 ± 0.128, Hx + SAG = 1.226 ± 0.326. For quantification, mean + SEM; n ≥ 3 experiments/condition; *p < 0.05 Student’s t test

