Fig. 2.
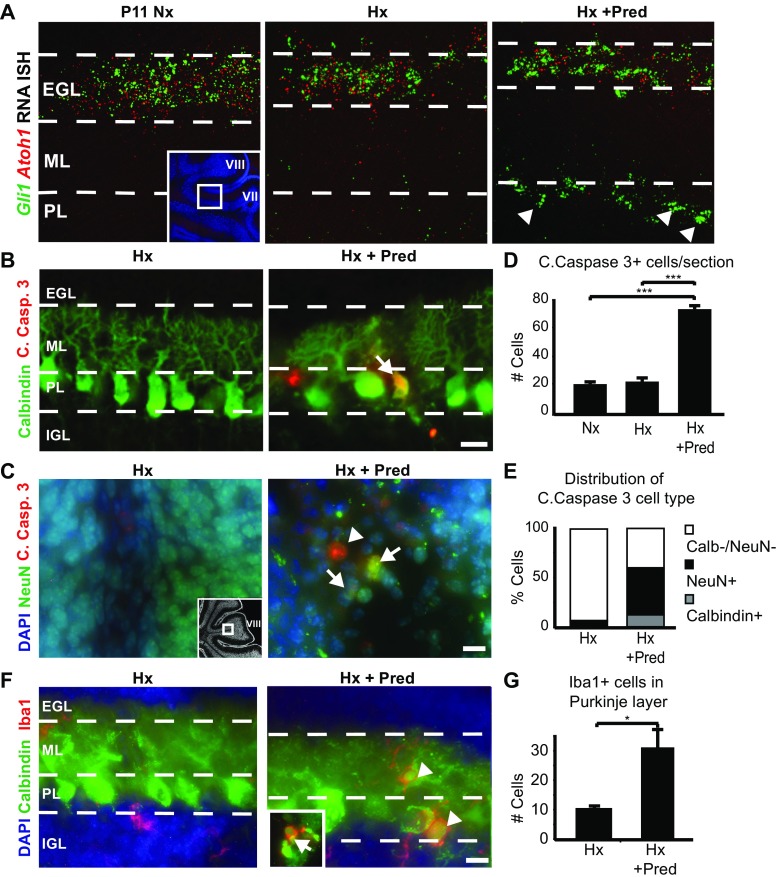
Glucocorticoid administration exacerbates chronic hypoxic injury to increase cerebellar damage through neuronal apoptosis. a Fluorescent in situ hybridization shows Shh signaling is decreased in animals reared in hypoxia (P11 Hx), and is exacerbated under dual injury hypoxia plus prednisolone (P11 Hx + Pred). Insert, diagram showing area of high magnification. EGL external granule layer, ML molecular layer, PL Purkinje layer. Arrow denotes Gli1 signal in the PL. b Representative images of the Purkinje cell layer (PL) showing absence or presence of Purkinje cells (Calbindin, red) undergoing apoptosis (C. Casp. 3, green) in hypoxic (P11 Hx) or hypoxic plus prednisolone (P11 Hx + Pred) samples at the end of the chronic hypoxic rearing. Arrow denotes double-labeled cell. EGL external granule layer, ML molecular layer, PL Purkinje layer, IGL internal granule layer. Scale bar, 10 μm. c Representative images of the IGL within lobule VIII of the cerebellum showing absence or presence of cerebellar granule neurons (NeuN, green) undergoing apoptosis (C. Casp.3, red) in Hx or Hx + Pred conditions at P11. Arrows denote double-labeled cells, arrowhead denotes C. Casp.3 only cells. DAPI blue for nuclear counterstain. Scale bar, 10 μm. Insert, low magnification image of cerebellum showing region of interest in lobule VIII from P11 sagittal cerebellar vermis. d Quantification of C. Casp.3 positive cells in normoxic (Nx), hypoxic (Hx), or hypoxic plus prednisolone (Hx + Pred) conditions. Nx, average counts = 20.75 ± 1.65 cells; Hx, average counts = 22.6 ± 2.54 cells; Hx + Pred, average counts = 53.86 ± 1.81 cells. e Distribution of apoptotic cells in Hx or Hx + Pred samples. Hx, Calb−/NeuN− = 93%, NeuN+ = 5%, Calbindin+ = 1%. Hx + Pred, Calb−/NeuN− = 40%, NeuN+ = 46.8%, Calbindin+ = 12.2%. f Representative images of Iba1-positive microglia in the Purkinje layer form lobule VII. Dashed lines denote layer borders similar to (a). Arrowheads denote Iba1+ cells in PL. Insert, example of a double-positive cell for Calbindin and Iba1. Scale bar, 10 μm. g Quantification of Iba1-positive cells in the PL in Hx and Hx + Pred samples. Hx, average counts = 9.5 ± 0.5 cells; Hx + Pred, average counts = 30.3 ± 7.5 cells. For quantification, mean + SEM; n ≥ 3 experiments/condition; *p < 0.05, ***p < 0.001, ANOVA with Tukey’s post-hoc correction

