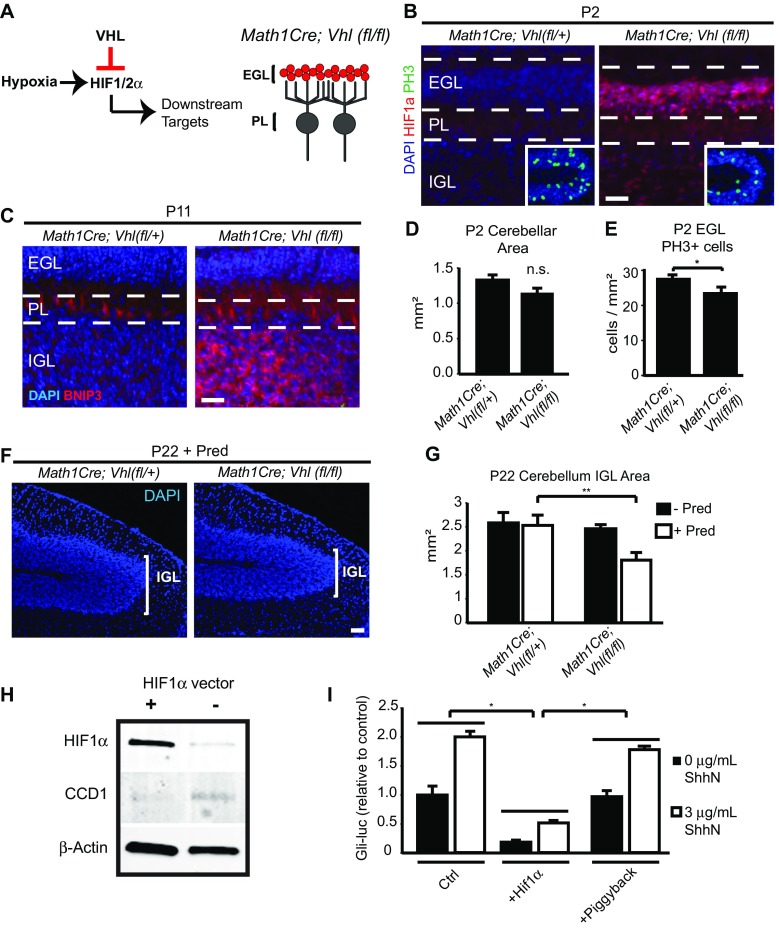
Fig. 4.
The HIF pathway plays a role in maintaining CGNP proliferation, and overactivation in CGNPs result in prednisolone-mediated cerebellar hypoplasia. a Right, schematic diagram showing HIF pathway. Left, schematic of cerebellar circuit highlighting CGNP-specific Cre recombination (red). EGL external granule layer, PL Purkinje cell layer. b Representative images of CGNPs in the external granule layer (EGL) and CGNs in the internal granule layer (IGL) with absence or presence of HIF1α (red). Insert, mitotic cells positive for PH3 (green) in the EGL. Nuclei counterstained with DAPI (blue). Scale bar, 50 μm. c P11 animals show increased expression of the HIF target BNIP3 in homozygous floxed animals only. Representative lobule 8 of cerebellar vermis. EGL external granule layer, PL Purkinje cell layer, IGL internal granule layer. Scale bar, 50 μm. d Quantification of cerebellar size at P2. n.s., no significant difference. e Quantification of PH3+ cells in EGL at P2. Math1Cre;Vhl(fl/+) = 27.17 ± 0.437 cells/mm2, Math1Cre;Vhl(fl/fl) = 23.16 ± 1.40 cells/mm2. For quantification, n ≥ 3 per experiments, *p < 0.05, Student’s t test. f Representative images of lobule 6 in P22 brains receiving Pred administration from P3 to P11. Nuclei are counterstained with DAPI (blue) to visualize IGL. Scale bar, 50 μm. g Quantification of IGL cross-sectional area in P22 transgenic mice. Math1Cre;Vhl(fl/+) = 2.49 ± 0.264 mm2 (n = 3), Math1Cre;Vhl(fl/fl) = 2.34 ± 0.103 mm2 (n = 4), Math1Cre;Vhl(fl/+) + Pred = 2.44 ± 0.257 mm2 (n = 7), Math1Cre;Vhl(fl/fl) + Pred = 1.57 ± 0.190 mm2 (n = 6). **p < 0.01, ANOVA with Tukey’s post-hoc correction. For quantification, n ≥ 3 experiments per condition. h Transfection of HIF1α overexpressing vector in primary CGNP cultures, and representative Western for HIF1α and cyclin D1 (CCD1), with β-Actin used for normalization. i Primary CGNP cultures from the Gli-Luciferase reporter mouse line were transfected with HIF1α construct and assayed for luciferase activity 24 h later. Values depicted as relative to signal intensity in control condition. Ctrl = 1 ± 0.15 arbitrary units (au), Ctrl + Shhn = 1.99 ± 0.098 au, HIF1a = 0.179 ± 0.0311 au, HIF1a + Shhn = 0.51 ± 0.018 au, Piggyback = 0.961 ± 0.092 au, Piggyback + Shhn = 1.77 ± 0.054 au. n = 3 per condition. *p > 0.05, Student’s t test

