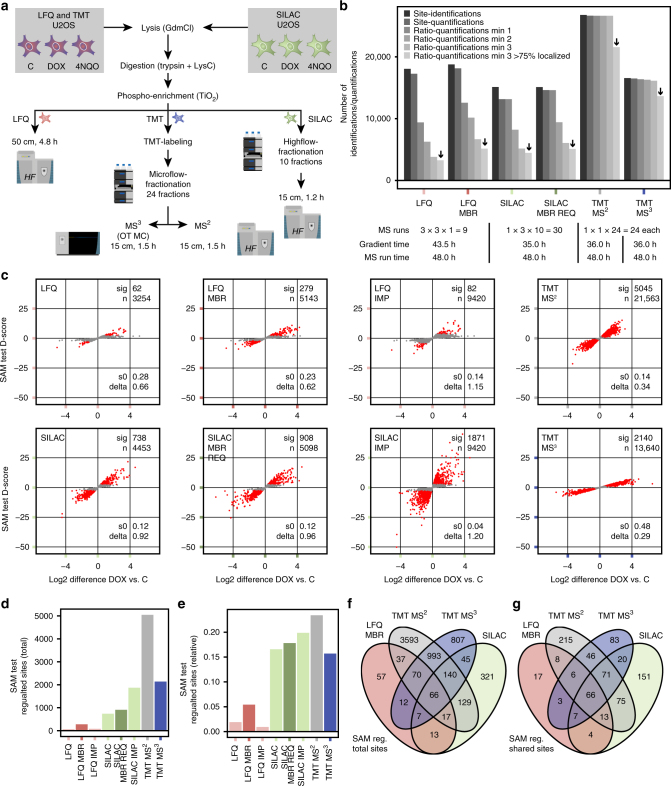
Fig. 3.
Evaluation of quantification methods in a biological setting. a Non- or SILAC-labeled U2OS cells were treated with 5 µM doxorubicin (DOX), 2.5 µM 4-nitroquinoline 1-oxide (4NQO) or DMSO (C) for 2 h before lysis. Three biological replicates were measured for all quantification methods. For MS measurement, each quantification method was given a total of 2 days instrument time (including LC overhead). SILAC samples were fractionated into ten fractions per sample on an Ultimate 3000 high-flow system, and TMT into 24 fractions total on an Ultimate 3000 micro-flow system. Samples were then measured using a 15- or 50-cm (only LFQ) column on a Q Exactive HF or Orbitrap Fusion Lumos (only TMT MS3 OT MC). For SILAC and TMT, MS samples were injected without dilution, so that each labeling channel resembles one LFQ injection. b Bar plot showing total numbers of identified and quantified phosphopeptides for all replicates of each quantification method, respectively. Calculations of ratios were performed within biological replicates and filtered for measurement in a minimum of one, two or three replicates, and >75% confident phosphorylation site localization. For further analysis, ratios quantified in all three replicates only and with a localization probability of at least 75% (black arrows) were used. c SAM-based identification of significantly regulated phosphorylation sites was performed with two sample paired t-test and standard settings (s0 estimation automatic, delta estimation based on FDR = 0.20). Significantly regulated phosphorylation sites (sig) are highlighted in red, non-significant sites in gray. Applied s0 and delta values, as well as the total number of tested phosphorylation sites (n) are shown. For LFQ and SILAC nearest neighbor imputation (IMP), phosphorylation sites quantified in at least one replicate and with a localization probability of at least 75% were used. d, e The bar plots show the number of significantly regulated phosphorylation sites for each quantification method d in total, and e as a fraction relative to the total number of tested sites. f, g The Venn diagrams show the overlap of SAM-regulated phosphorylation sites identified f in total, and g for commonly identified sites

