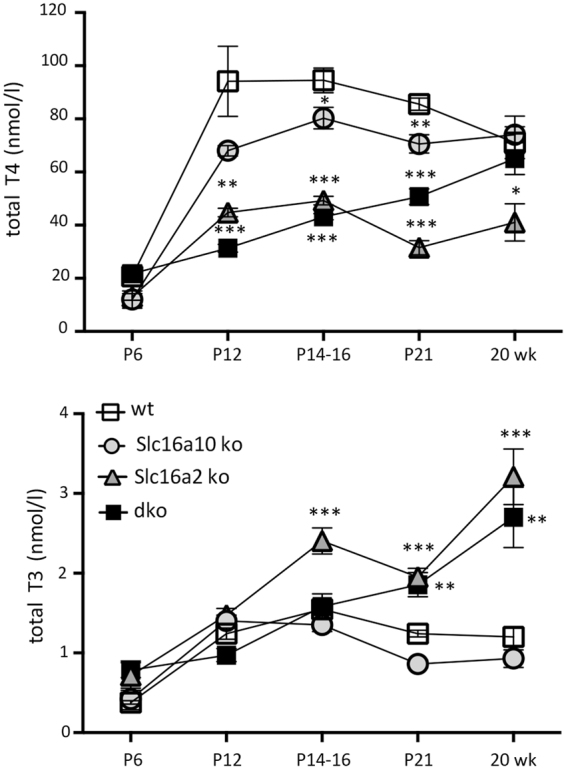
Figure 2.

Serum T4 and T3 levels. T4 and T3 were measured at postnatal and adult (20 week) ages (mean ± sem). Comparison across all genotypes was determined using two-way ANOVA and Tukey’s post hoc analysis. For mutants versus wt, for T4 at P12: ***p < 0.001, **p = 0.0011; at P14–16: *p = 0.0277, ***P < 0.001; at P21: ***p < 0.001, **p = 0.0059; at 20 weeks: *p = 0.0416. For T3 at P14-16: ***p < 0.001; at P21: **p = 0.0013, ***p < 0.001; at 20 weeks: ***p < 0.001, **p = 0.0051.
