Figure 8.
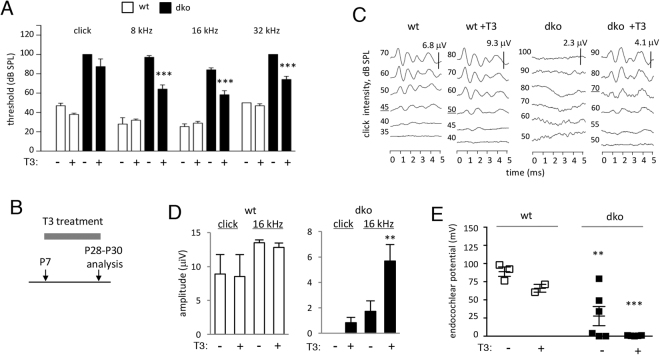
Auditory responses in dko mice after T3 treatment. (A) ABR mean thresholds at P28 after treatment with T3 in drinking water from P7 to P28. Groups contained 5 wt and 6 dko. Comparisons were made within genotype by two-way ANOVA; ***p < 0.001. (B) Scheme for treatment with T3. (C) Enhanced definition and amplitudes of ABR peaks in T3-treated mice; representative traces for a click stimulus. Note different scale bars (μV) for wt and dko. (D) Waveform amplitudes (mean ± sem) in wt and dko mice. Amplitudes were determined for peak 1 to the following trough for a click and representative pure tone (16 kHz) stimulus. T3 made little difference in wt mice (p > 0.3) but enhanced amplitudes in dko mice for 16 kHz (**p = 0.0022) and a click (but not statistically significant, p = 0.5602). Groups of 3 untreated and 5 treated wt; 5 untreated and 6 treated dko. (E) Endocochlear potential in dko mice was not restored by treatment with T3. The endocochlear potential was significantly reduced in untreated dko (**p = 0.01) and T3 treated dko (***p < 0.001) compared to wt untreated mice at this age, similar to the defect in adult mice.

