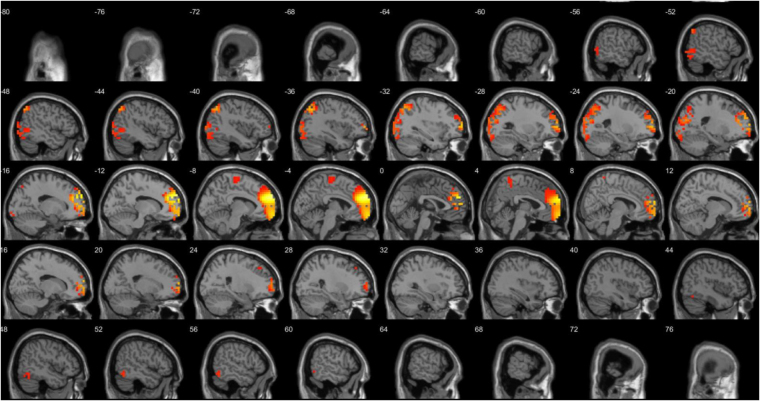
Figure 8.
A comparison between the three different groups (anodal, cathodal and sham) after stimulation revealed different significant effects. For the comparison between anodal and cathodal stimulation it showed a significant difference for the beta3 frequency band (F = 2.64, p < 0.05) (see Fig. 8). This analysis showed increased activity overlaying the anterior cingulate cortex extending into the pregenual anterior cingulate cortex, ventromedial prefrontal cortex for anodal stimulation in comparison to cathodal stimulation. No significant effect was obtained for the delta, theta, alpha1, alpha2, beta1, beta2, and gamma frequency bands.

