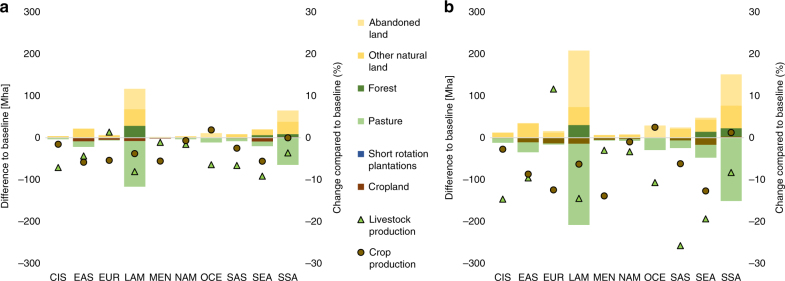
Fig. 4.
Impact of non-CO2 mitigation efforts on land use and agricultural production. Bars present the change in land use in Mha at a carbon price of a 40 $/tCO2eq and b 100 $/tCO2eq in 2050 compared to the baseline scenario without carbon prices. Single points display the relative change in agricultural production compared to the baseline in 2050. EUR Europe, CIS Commonwealth of Independent States, NAM North America, LAM Latin and Central America, SSA Sub Saharan Africa, MEN Middle East and North Africa, EAS East Asia, SAS South Asia, SEA Southeast Asia, OCE Oceania

