
Fig. 1.
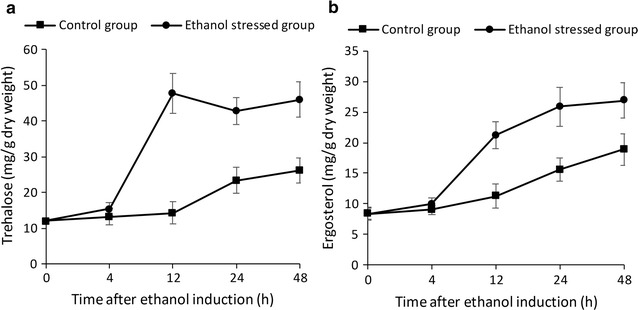
Intracellular concentrations of trehalose and ergosterol in ethanol-stressed I. orientalis. The data were obtained at the indicated times (h) after ethanol was introduced into the culture. Values are represented as mean ± S.D. Three biological replicates were used. a Intracellular trehalose. b Intracellular ergosterol