
Fig. 2.
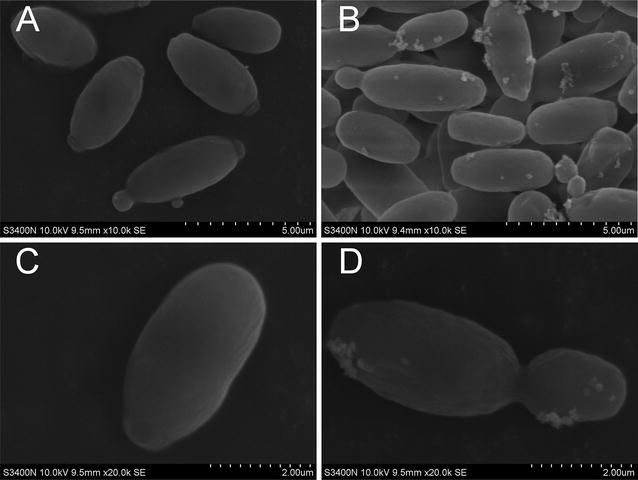
SEM images of control and ethanol-stressed I. orientalis cells. SEM images were captured after ethanol stress for 24 h. A Control cells at a magnification of 10,000×. B Ethanol-stressed cells at a magnification of 10,000×. C Control cells at a magnification of 20,000×. D Ethanol-stressed cells at a magnification of 20,000×