
Fig. 5.
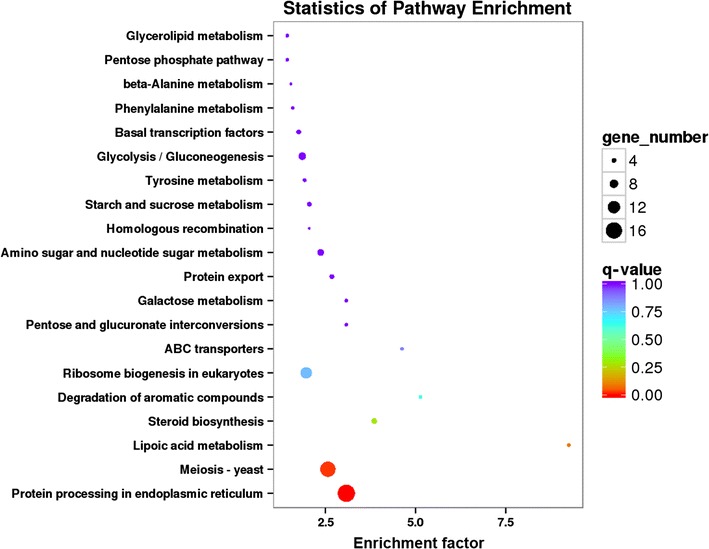
KEGG pathways enrichment analysis. The diameter of the circle is proportional the number of DEGs enriched in each pathway. The color of circle represents the q-value for enrichment
Official websites use .gov
A
.gov website belongs to an official
government organization in the United States.
Secure .gov websites use HTTPS
A lock (
) or https:// means you've safely
connected to the .gov website. Share sensitive
information only on official, secure websites.
KEGG pathways enrichment analysis. The diameter of the circle is proportional the number of DEGs enriched in each pathway. The color of circle represents the q-value for enrichment