
Fig. 6.
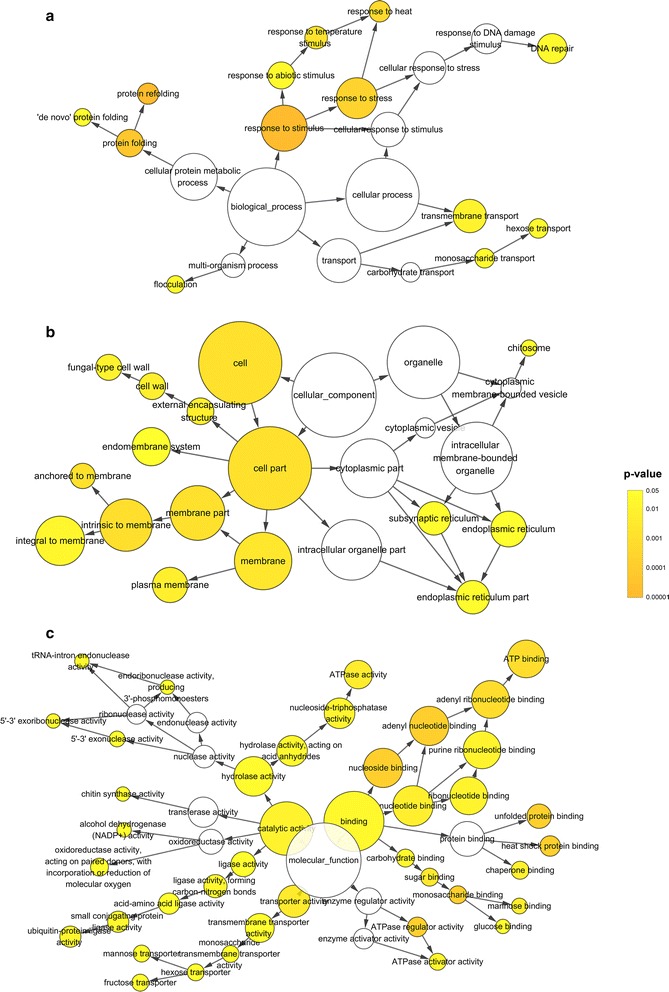
Gene Ontology enrichment analysis using Cytoscape-BiNGO. The number of enriched DEGs in each GO category is proportional to node diameter. Darker nodes are associated with lower P-values. a Biological process. b Cellular component. c Molecular function