
Figure 2.
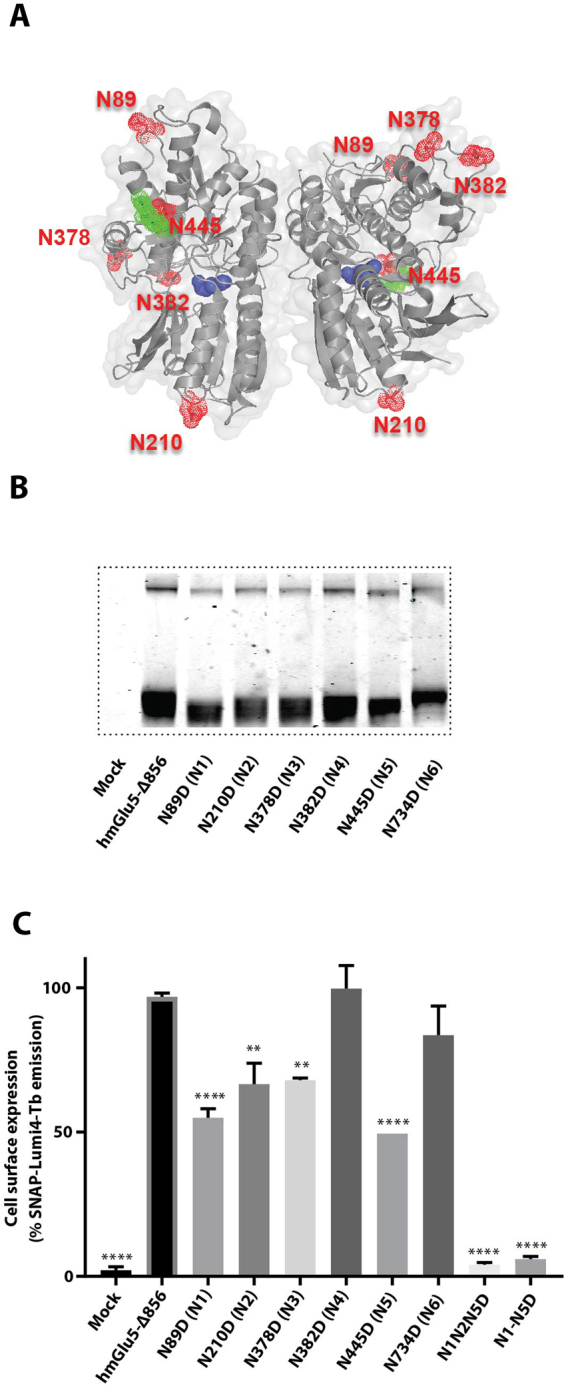
Characterization of the SNAP-mGlu5-∆856 N-glycosylation profile in HEK293 cells. (A) The five mGlu5 N-linked glycosylation sites are highlighted as surface spheres (red) and the sugar moieties in green on the cartoon structure (grey) of the VFT (code pdb 3LMK). Atoms in the glutamate molecules bound to the VFT are represented as blue spheres. (B) SDS-PAGE gel migration of monomeric SNAP-mGlu5-Δ856 and different N-glycosylation mutants. Samples were treated with reducing agent (DTT). (C) Cell surface expression of the fluorescently labeled SNAP-mGlu5-Δ856 and different N-glycosylation mutants using SNAP-Lumi4Tb. Gel is representative of one experiment repeated at least two time. Expression profiles are representative of at least three separate experiments. Dunnett’s test as part of one-way ANOVA was used for comparison with hmGlu5-Δ856 set as reference level.