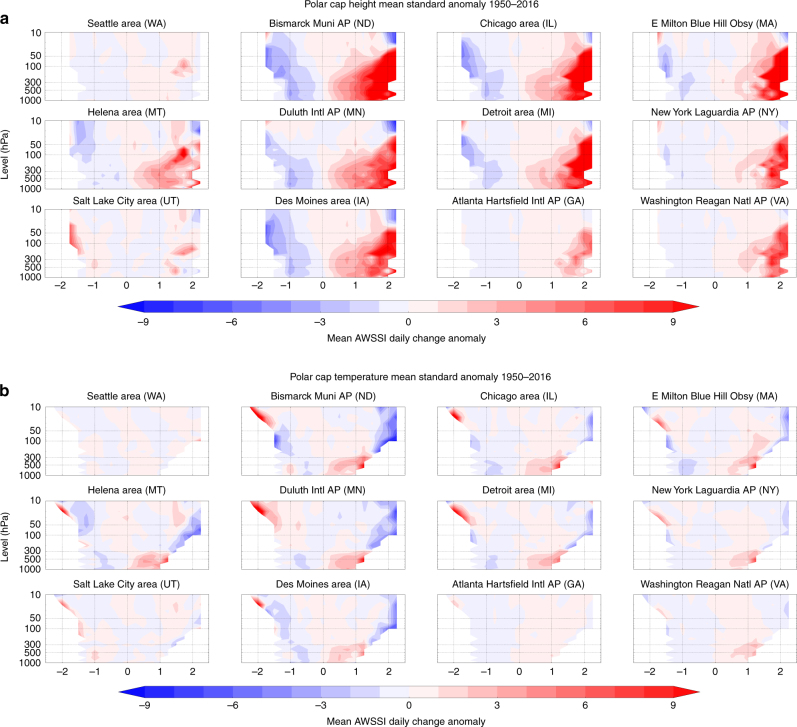
Fig. 2.
Warm Arctic related to increased severe winter weather. The departure from the winter average in daily change in the AWSSI (Accumulated Winter Season Severity Index) at several weather stations across the US during December–February shown at all levels between 1000 and 10 hPa. AWSSI is plotted with composited values of the polar cap geopotential height (PCH, a) and air temperature (PCT, b) standardized anomalies from the surface to the mid-stratosphere (10 hPa), north of 65° N, from 1950 to 2016. Anomalies computed relative to climatology from 1981–2010. Results for all stations are consistently statistically significant at p < 0.01. Statistical significance for both PCH and PCT at selected levels for all cities shown in Supplementary Table 1

