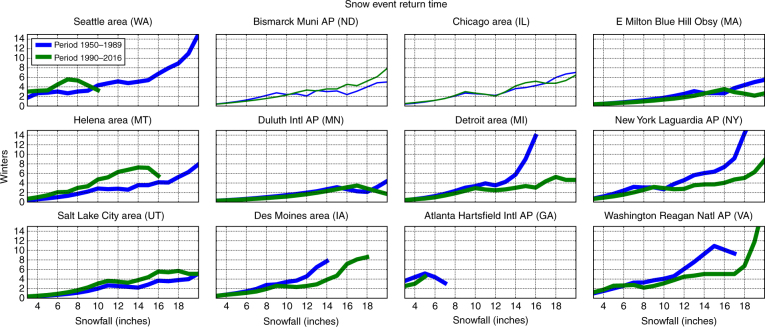
Fig. 9.
Major snowfalls in eastern US are becoming more frequent. The return period (y axis; 0 to 15 years) of varying snowfall events (x axis; 0 to 18 inches) for weather stations during two periods: cold Arctic (1950–1989; blue) and warm Arctic (1990–2016; green). Lower values indicate more frequent snowfalls (shorter return period). The time series that were found to be significantly different at the 95% confidence level are shown in bold lines and include Atlanta, Boston (Blue Hill), Des Moines, Detroit, Helena, New York, Salt Lake City, Seattle, and Washington

