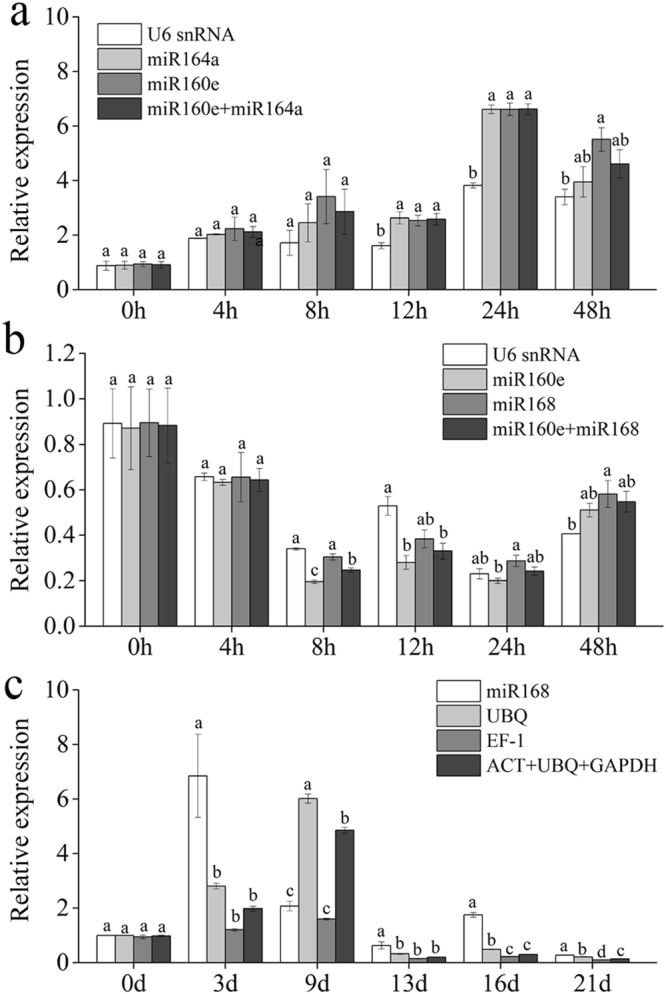
Figure 5.

Relative expression of target genes. Different miRNAs were chosen to be target genes for different abiotic stresses. Selected reference genes or gene combination was used to normalize the expression results. (a) salinity stress. The columns represent the relative expression of miR319. (b) cold stress. The columns represent the relative expression of miR319. (c) drought stress. The columns represent the relative expression of miR408.
