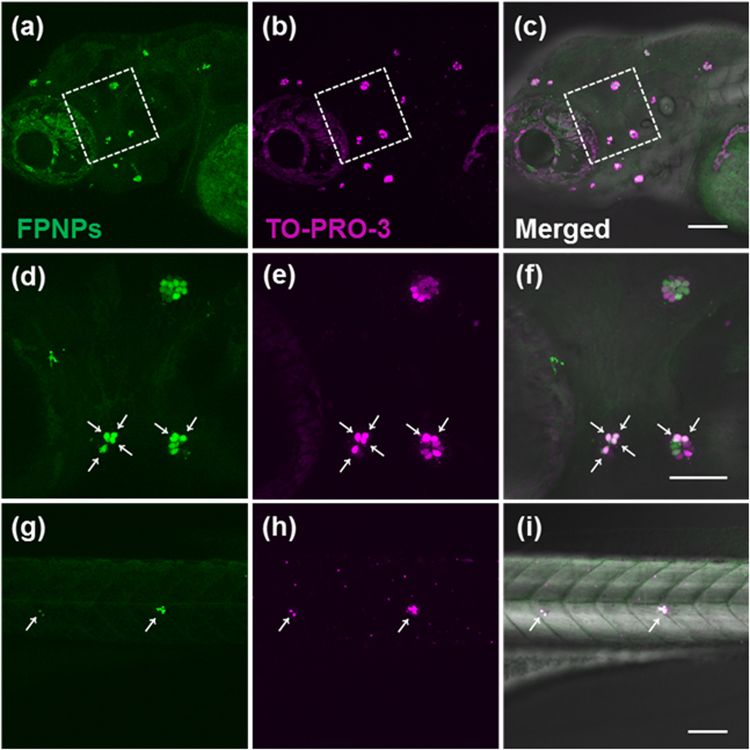
Figure 5.
Live hair cells are double labelled with FPNPs (2 mg mL−1) and TO-PRO-3 (2 μM) in zebrafish. The panels (a,d and g) show the cells stained with FPNPs (excitation wavelength at 405 nm, emission wavelength at 488 nm, respectively). The panels (b,e and h) show the fluorescence images by TO-PRO-3 (excitation wavelength at 635 nm, emission wavelength at 647 nm, respectively). The panels (c,f and i) show the overlay images of (a) + (b), (d) + (e), and (g) + (h), respectively. White arrows (d,e, f,g,h and i) indicate the co-stained hair cells. The enlarged images of the white boxed areas in (a,b and c) correspond to (d),(e), and (f), respectively. Scale bars: 50 μm (a–f), 100 μm (a–c and g–i).

