Fig. 1.
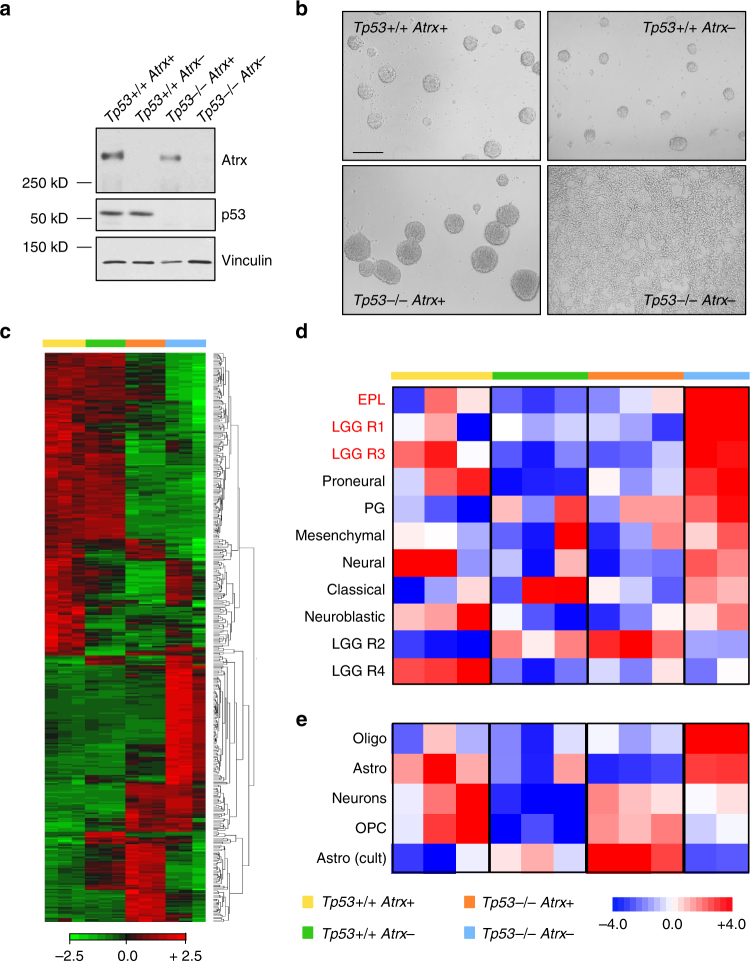
Atrx deficiency alters the morphology and gene expression profiles of mNPCs. a Western blot demonstrating effective cre-recombinase-mediated Atrx inactivation. p53 levels are also shown (Vinculin loading control). b micrographs showing mNPC morphology at 5 passages following Atrx inactivation (representative of three biological replicates; scale bar 100 µm). c heat map showing differentially expressed genes across isogenic mNPCs (Tp53+/+ Atrx+ : yellow, Tp53+/+ Atrx−: green, Tp53−/− Atrx+ : orange, and Tp53−/− Atrx-: blue). d, e heat map showing ssGSEA correlations between mNPC expression profiles and transcriptional signatures derived from glioma subtypes (d) and mature murine nervous system constituents (e). Glioma subtypes exhibiting high rates of ATRX deficiency shown in red. EPL early progenitor-like, PG pre-glioblastoma, Oligo oligodendrocyte, Astro astrocyte, OPC oligodendroglial precursor cell, Astro (cult) cultured astrocyte

