Fig. 4.
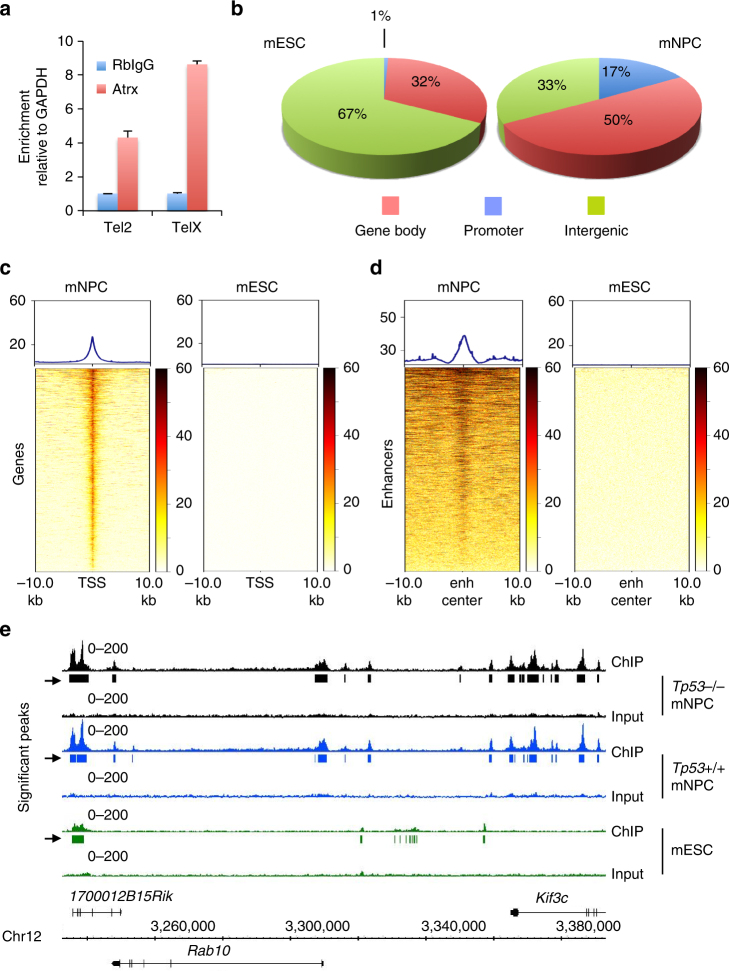
Atrx exhibits an extensive, gene regulatory binding pattern in mNPCs. a qPCR analysis of Atrx ChIP in mNPCs shows enrichment over rabbit immunoglobulin control (RbIgG) at previously reported Atrx binding sites (Tel2: P = 0.0010, TelX: P = 3.8 × 10⁻⁸; 3 replicates; error bars reflect standard deviation; P values determined by unpaired two-tailed t-test). b–d Atrx ChIP-seq in mNPCs reveals greater numbers of enrichment peaks within gene body and promoter regions (b) than previously reported in mESCs18. Notable clustering around TSSs (c) and enhancers (d; enh center) is also seen, contrasting sharply with Atrx peaks in mESCs. e sample ChIP-seq traces for mNPCs (Tp53−/− and Tp53+/+) and mESCs showing distinct Atrx binding patterns between cell types

