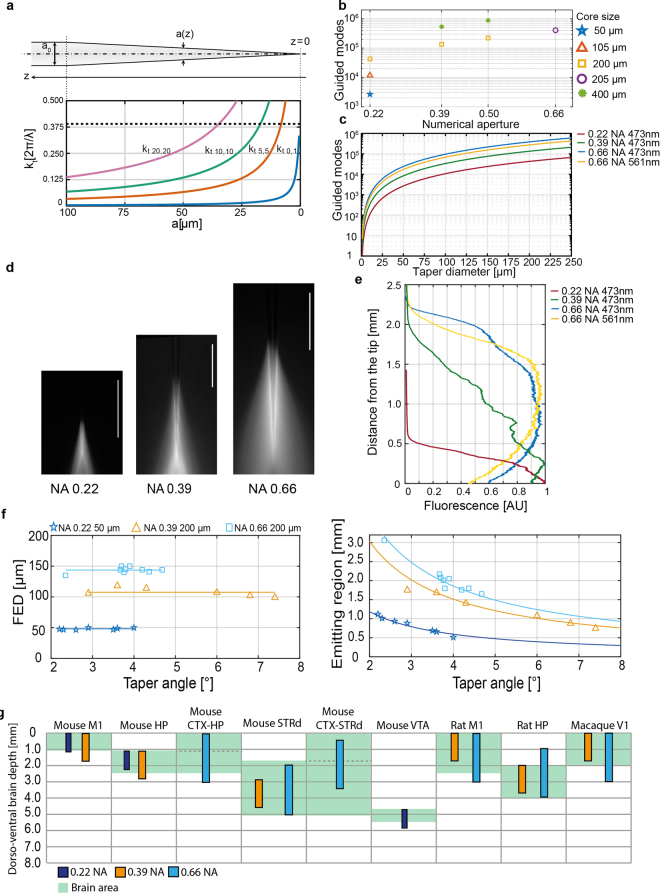
Figure 1.
Tailoring TF devices emission lengths. (a) (top) Schematic representation of a tapered optical fiber. (bottom) Evolution of the transversal propagation constant of four different guided modes as a function of the taper diameter. (b) Number of modes sustained by fiber optics with increasing core size and NA. (c) Number of guided modes at increasing diameters of the tapered section for fibers with 50 µm core/0.22 NA at 473 nm (red curve), 200 µm core/0.39 NA at 473 nm (green curve), and 200 µm core/0.66 NA at 473 nm (blue curve) and 561 nm (yellow curve). (d) Fluorescence image of light emission for a fiber with 50 µm core/0.22 NA (left), 200 µm core/0.39 NA (center), and 200 µm core/0.66 NA (right), ~3.7° taper angle, injected with 473 nm light; scale bars are 1 mm. (e) Normalized intensity profile measured along the taper surface for the three fibers in panel (d) injected with 473 nm light; the yellow curve represents the emission profile of a NA = 0.66 TF injected with 561 nm light. (f) First Emission Diameters (left) and Emission Lengths (right) for different fiber types with increasing taper angle. (g) Diagram of dorso-ventral depth of brain regions targetable with optogenetic stimulation in mouse, rat and macaque. The shaded areas in the background represent the dorso-ventral extension of each region as obtained from on-line brain atlas. Colored bars display the maximum emission length provided by TFs with NA = 0.22 (dark blue), NA = 0.39 (orange), and NA = 0.66 (pale blue). M1, primary motor cortex; HP hippocampus; CTX, cortex; STRd, dorsal striatum; VTA, ventral Tegmental Area; V1, primary visual cortex. For panels d–g, data pertaining 0.22 NA and 0.39 NA fibers were reused from Pisanello et al.21.

